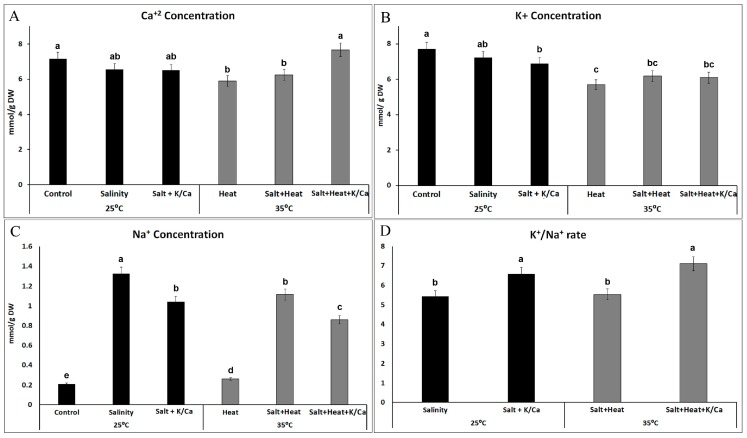
Figure 2.
Ca2+, K+ and Na+ concentration (A–C) and K+/Na+ ratio (D) in tomato leaves grown under control, salinity (60 mM NaCl) or salinity combined with higher K+ and Ca2+ concentration in the irrigation solution under optimal temperature (25 °C) or under heat stress (35 °C). Values represent means ± SE (n = 6). Bars with different letters represent data with significant differences at p < 0.05 (Tukey HSD).

