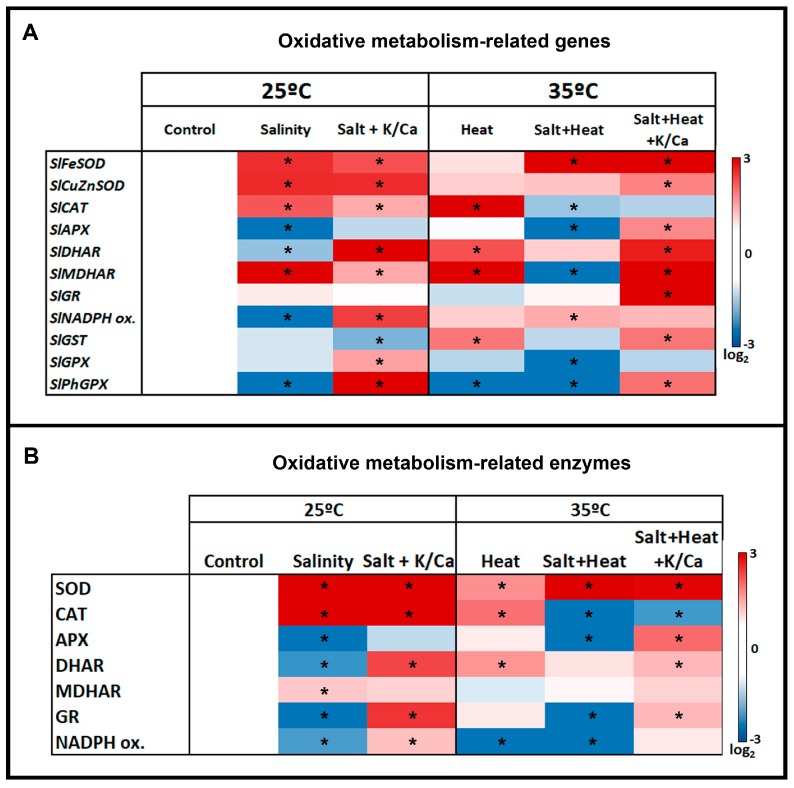
Figure 5.
Oxidative metabolism-related gene expression (A) and enzymatic activities (B) in tomato leaves grown under control, salinity (60 mM NaCl) or salinity and higher concentration of K+ and Ca+2 in the irrigation solution at optimal temperature (25 °C) or heat stress (35 °C). Red color represents a higher relative expression or activity with respect to control plants and blue color represents a lower relative expression or activity. Scale is the log2 values of the expression after normalization with respect to control plants. Absolute values (gene expression and enzymatic activities) as well as log2 values can be found in Supporting Information Tables S2–S5, respectively. Asterisks are representative of significant differences with respect to control plants (p < 0.05).

