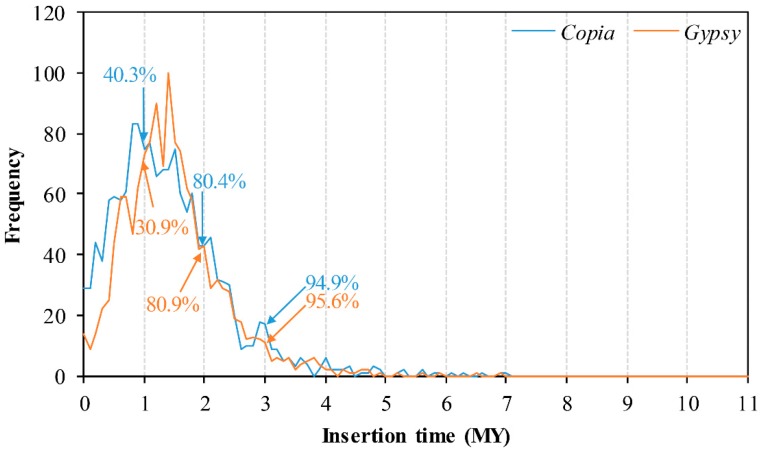
Figure 5.
Overall insertion time distribution and amplification of full-length elements in the mulberry genome. Insertion times were split into bins of 0.1 MY. The x-axis denotes insertion time ranges for all full-length elements of Copia and Gypsy. The y-axis denotes the frequency of element insertions per time interval. The distribution pattern does not resemble an exponential distribution.

