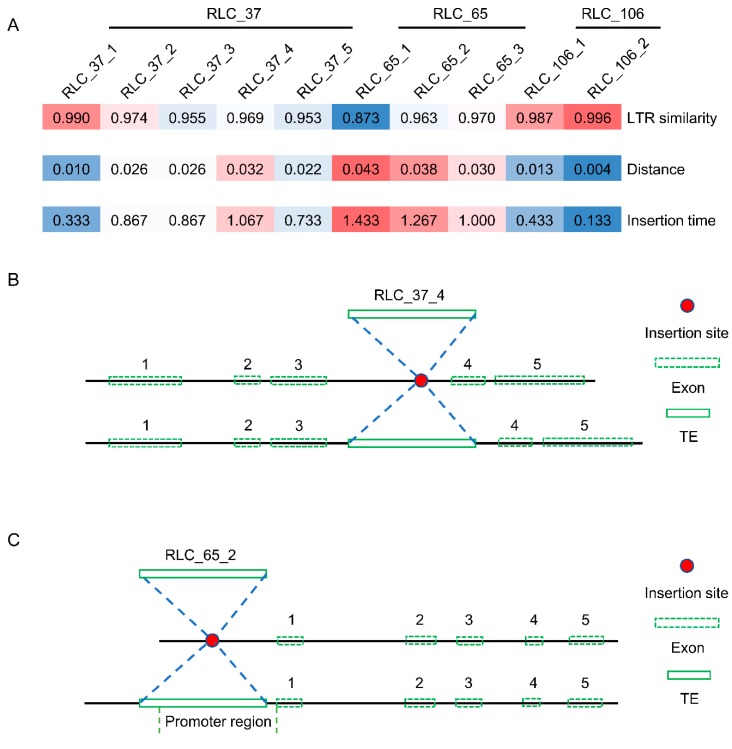
Figure 8.
Insertion time and position analysis of three Copia families. (A) Insertion time analysis of the three Copia families. The “distance” here means the K values, which were used to calculate the insertion time using the equation T = K/2r; (B) Insertion position structure of the RLC_34_4 element. RLC_37_4 was inserted into the third intron of a mulberry gene (NCBI reference sequence, XM_010093293); (C) Insertion position structure of the RLC_65_2 element. RLC_65_2 was inserted into the promoter region of a mulberry gene (NCBI reference sequence, XM_010114426). Red plot means insertion site. Green box with dashed line means the exon. Numbers 1–5 correspond to exons 1–5. Green box with a solid line means the corresponding TE element. Figure 8B,C was drawn according to the actual length of each exon.

