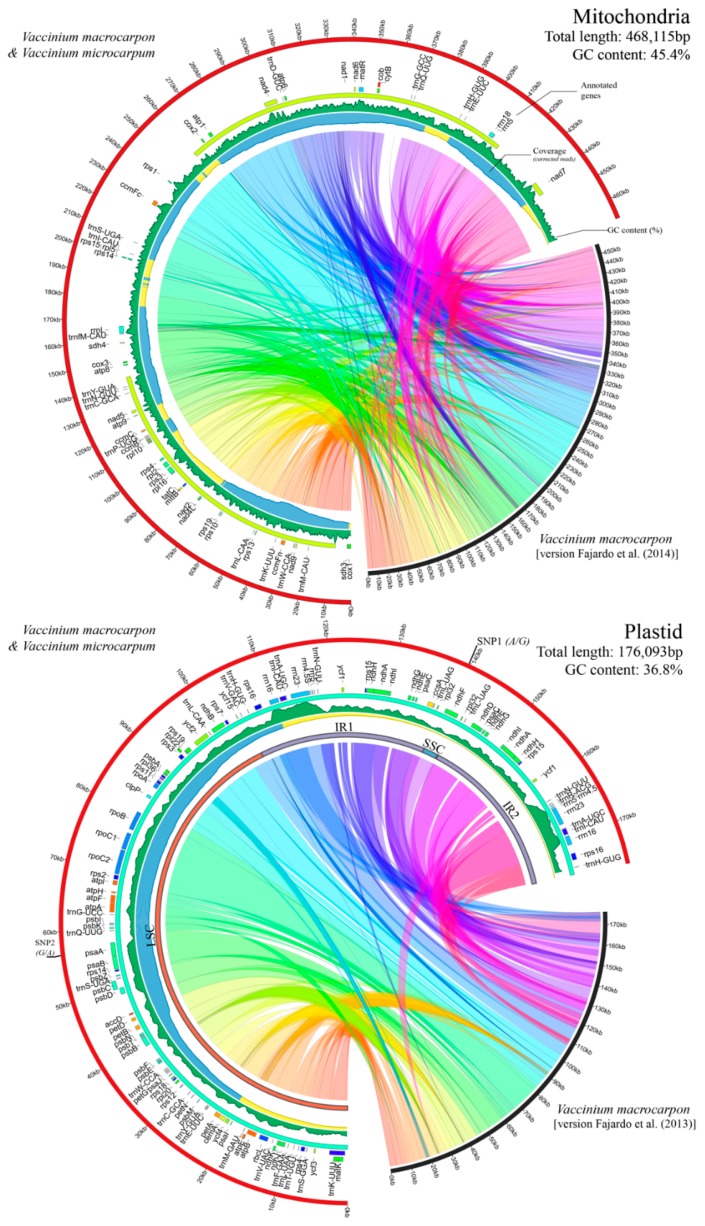
Figure 2.
Organelle genomes of V. macrocarpon and V. microcarpum. A comparison between the PacBio assemblies presented in this study and previously published cranberry organelle versions [29,30] are shown; collinear regions were calculated using MuMmer with default parameters (see Materials and Methods). Since V. macrocarpon and V. microcarpum presented near-identical organelles, for the plastid genome, only single nucleotide polymorphism (SNP) positions are provided, and the mitochondria shown are identical. Gene annotations are shown as tiles in internal tracks; colors were randomly assigned to highlight different categories of protein-coding genes, ribosomal RNA and tRNA. Sequencing coverage is provided in area plots oriented inwards, where blue, yellow, and red represent genome areas with >30×, >10×, and ≤10× coverage, respectively (based on PacBio corrected reads). GC content is also provided as a green-colored area plot. In the plastid, large single copy (LSC), small single copy (SSC), and inverted repeats (IR1 and IR2) are highlighted with red, blue, and purple concentric bars.

