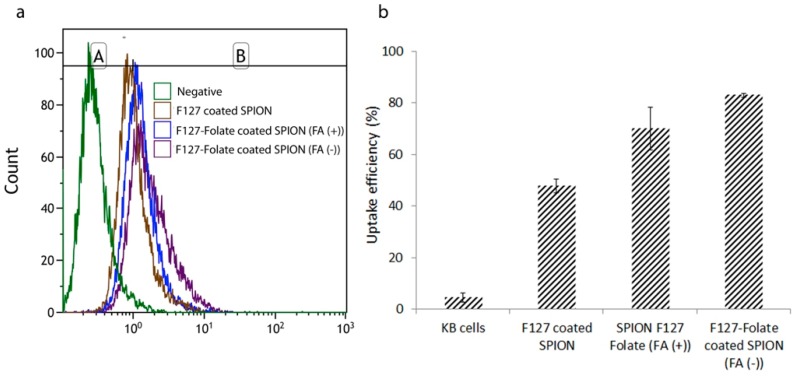
Figure 9.
Flow cytometry analysis (FACs). KB cells were incubated with 50 µg/mL iron F127 coated SPION; F127-Folate coated SPION in the media with and without folic acid (5 ng/mL). Histogram (a) shows the cell fluorescent signal, graph (b) presents uptake efficiency. Gate region A was chosen for non-uptake particles, while gate region B indicates the uptake (n = 4, cell counted number: 10,000, iron concentration for incubation 50 µL/mL).

