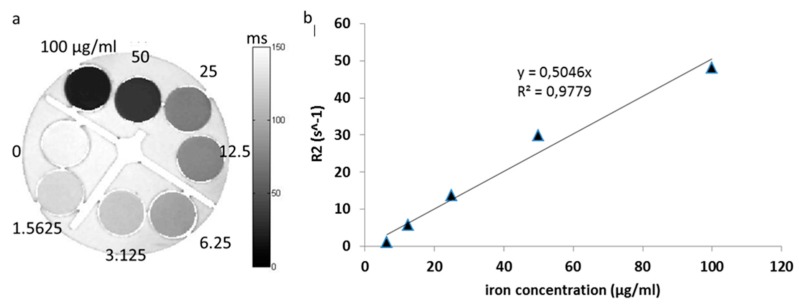
Figure A2.
T2 relaxation of F127 coated SPION. F127 coated SPION was diluted in various concentrations, ranging from 100 µg to 1.5625 µg/mL and aliquot to NMR tubes. Next, T2 map was taken by choosing different TE (from 7.76 ms to 62 ms in steps of 10), TR of 5000 ms, number, or average (NA) of 20, matrix size of 256 x 256, field of view (FOV) of 22 × 22 mm2, slice thickness (TH) of 0.5 mm. (a) T2 map of F127 coated SPION, (b) R2 relaxation time graph represents the correlation between iron concentration and R2 relaxation time. Numbers in (a) indicate iron concentration (µg/mL).

