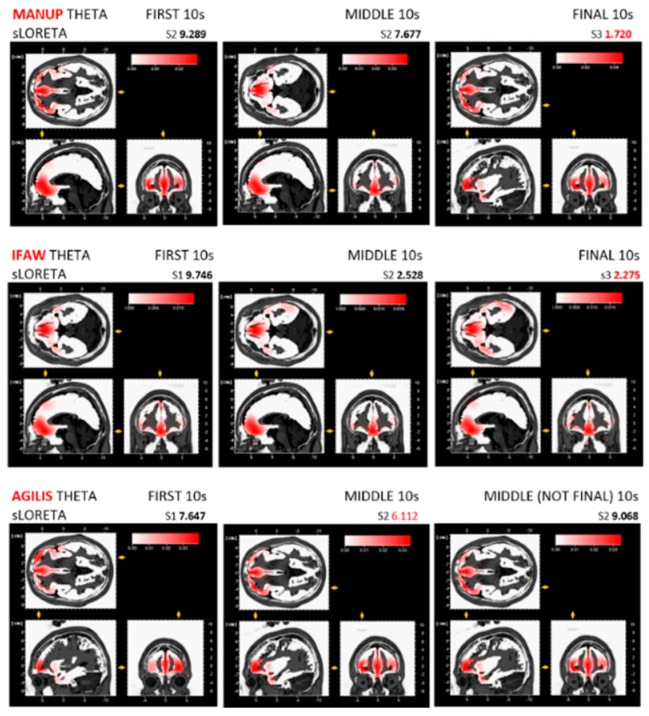
Figure 5.
ManUp, Agilis, and IFAW sLORETA tomographic maps of three highest theta amplitudes from the first, middle, and final 10-s epochs (includes BVA sec times (not ad times) for 10-s epochs). *Agilis shows two sLORETA tomographic maps from the middle 10-s epoch, not final 10-s epoch, as three highest theta amplitudes occurred in the first and middle epochs, not the final epoch.

