Figure 3.
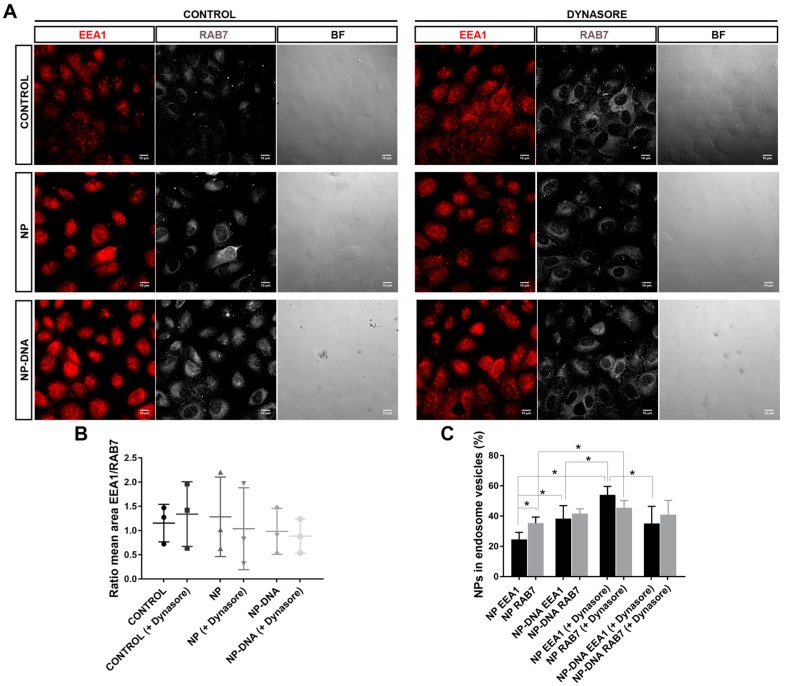
A significant pool of DNA-wrapped gold NPs colocalized in early and late endosomes in differentiated ARPE-19 cells. (A) After 2 h post-transfection, a significant pool of NPs colocalized in early endosomes (early endosome marker EEA1, in red) and late endosomes (mature endosome marker RAB7, in white). NPs are visualized as black dots in the optic transmission microscopy channel (BF). Dynasore treatment (panels at the right) was also performed to inhibit dynamin-mediated uptake events. The merge field is not shown since nanoparticles were not distinguishable on the dark background of immunofluorescent images, but image analyses of colocalization were performed by using masks over different channels. (B) The number of early and late endosomes was analysed as a ratio (to normalize per cell and condition). After 2 h of transfection with NPs, the ratio EEA1/RAB7 was variable but not significantly different either between cells treated with dynasore compared to controls or between control cells compared to cells transfected with pristine gold NPs or DNA nanoparticles. (C) Percentage of pristine NPs and DNA–nanoparticle colocalization with early or late endosomes/cell. At 2 h post-transfection, NPs showed a fluid trafficking between early and late endosomal compartments, as detected by 35% localization in late (35%) versus 25% in early endosomes. Instead, DNA NPs showed a higher localization in the endosomal compartment (close to 100%) but with a similar distribution between early and late endosomes. The addition of dynasore changed the proportion of NPs detected in early and late endosomes when analysing pristine NPs, but not when analysing DNA NPs, indicating that internalization and intracellular trafficking routes differ between pristine gold NPs and DNA NPs. Representative images from three independent replicates (three images per replicate and condition) were quantified. Statistical significance was analysed by the non-parametric Mann–Whitney test (* indicates p < 0.05).

