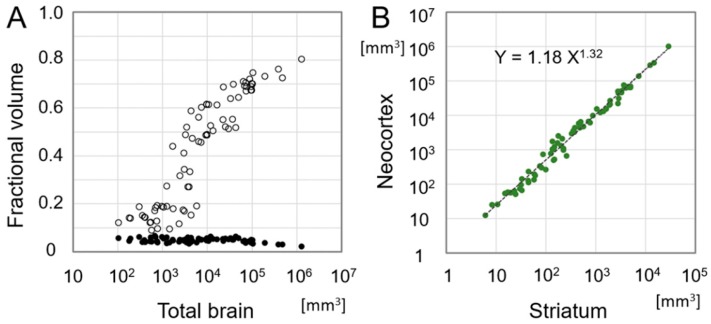
Figure 2.
Evolutionary scaling relation between the striatum and neocortex. (A) A plot showing fractional volumes of the striatum (black dots) and the neocortex (open circles) in the total brain volume, which is defined as 1. The data are according to measurements of 76 species from insectivorous mammals to human [94]. Note that the striatal fraction is relatively constant throughout mammalian evolution whereas the neocortical fraction increased explosively. (B) A plot showing the volume of the neocortex as a function of the volume of the striatum according to the same data shown in (A). The best-fit exponential formula is: Y = 1.18X1.32, where X and Y are the volume of the striatum and the neocortex in cubic millimeters, respectively.

