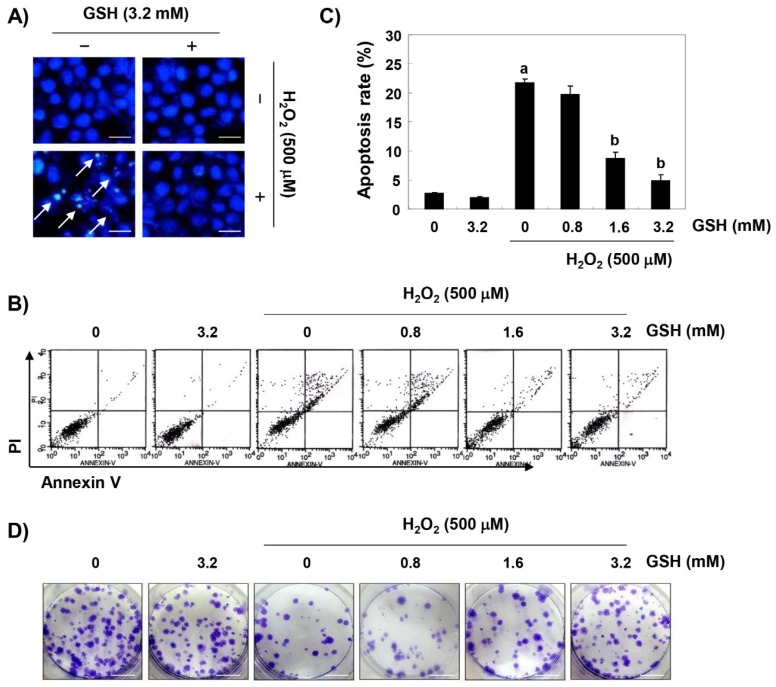
Figure 2.
The inhibitory effects of glutathione against H2O2-induced apoptosis in RAW 264.7 cells. Cells were pretreated with the indicated concentrations of glutathione for 1 h and then stimulated with or without 500 μM H2O2 for 24 h. (A) The cells were fixed and stained with 4,6-diamidino-2-phenylindole (DAPI) solution, and the stained nuclei were pictured under a fluorescence microscope (original magnification, ×400). Representative photographs are shown. Scale bar, 50 µm. (B,C) The cells were stained with fluorescein isothiocyanate (FITC)-conjugated annexin V and propidium iodide (PI) for a flow cytometry analysis. (B) The results showed necrosis, defined as annexin V-negative and PI-positive cells (lower upper quadrant), early apoptosis, defined as annexin V-positive and PI-negative cells (lower right quadrant), and late apoptosis, defined as annexin V-positive and PI-positive (upper right quadrant) cells. (C) The percentages of apoptotic cells were determined by expressing the numbers of Annexin V-positive cells as percentages of all the present cells. The results are presented as the means ± SD of three independent experiments (a p < 0.05 compared with the control group; b p < 0.05 compared with the H2O2-treated group). (D) After treatment, the cells were further cultured for two weeks to form colonies, then stained with a 0.1% purple-violet solution and imaged under inverted microscopy. Representative photographs are shown. Scale bar, 5 cm.

