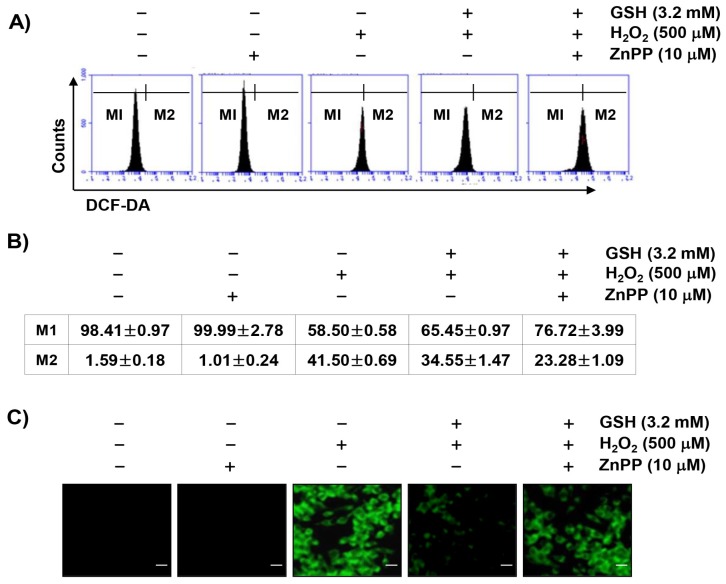
Figure 4.
Inhibition of H2O2-induced ROS generation by glutathione in RAW 264.7 cells. Cells were pretreated with 3.2 mM glutathione or 10 μM ZnPP for 1 h and then treated with 500 μM H2O2 for 1 h. (A) After staining with 2′,7′-dichlorofluorescein diacetate (DCF-DA) fluorescent dye, DCF fluorescence was monitored by flow cytometer and fluorescent signals were displayed as histograms. (B) M1 is placed around the cells where no ROS is generated. M2 represents the percentage of cells that increase the reactive oxygen species (ROS) production. The data were shown as the mean ± SD obtained from three independent experiments. (C) Images were obtained by a fluorescence microscope (original magnification, ×200). Images are representative of at least three independent experiments. Scale bar, 20 µm.

