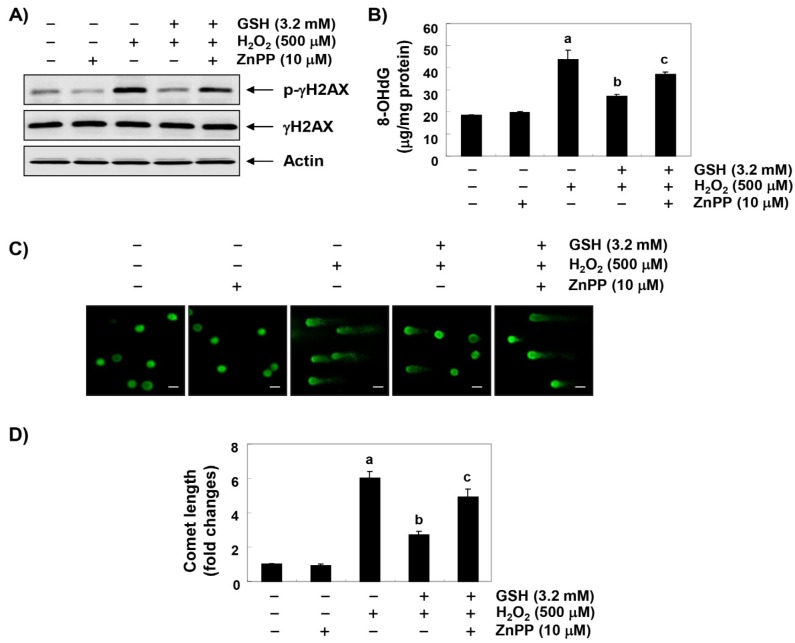
Figure 5.
Protection against H2O2-induced DNA damage by glutathione in RAW 264.7 cells. Cells were pretreated with 3.2 mM glutathione or 10 μM ZnPP for 1 h and then stimulated with or without 500 mM H2O2 for 24 h. (A) The cellular proteins were prepared, and p-γH2AX and γH2AX protein levels were assayed by Western blot analysis using an ECL detection system. Actin was used as an internal control. (B) The amount of 8-OHdG in the DNA was determined using an 8-OHdG-EIA kit. The measurements were made in triplicate, and values are expressed as the mean ± SD (a p < 0.05 compared with the control group; b p < 0.05 compared with the H2O2-treated group; and c p < 0.05 compared with the glutathione- and H2O2-treated group). (C,D) The comet assay was performed, representative images of the comet assay were taken by a fluorescence microscope (original magnification, ×200, Scale bar, 40 µm) and the comet length (fold of control) was quantified (a p < 0.05 compared with the control group; b p < 0.05 compared with the H2O2-treated group; and c p < 0.05 compared with the glutathione- and H2O2-treated group).

