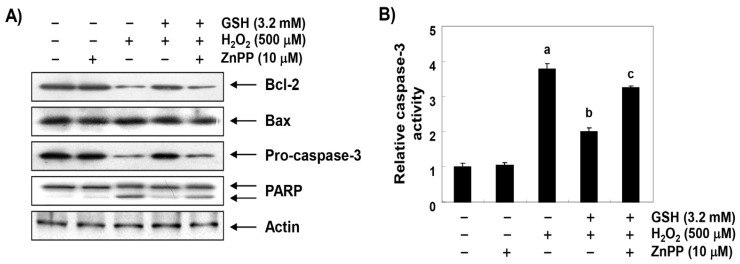
Figure 7.
Effects of glutathione on the expression of apoptosis regulatory genes in H2O2-treated RAW 264.7 cells. (A) After a treatment with 3.2 mM glutathione or 10 μM ZnPP in the presence or absence of H2O2 for 24 h, the cellular proteins were prepared, and the protein levels were assayed by Western blot analysis using an ECL detection system. Actin was used as an internal control. (B) The cells were lysed, and aliquots were assayed for in vitro caspase-3 activity using DEVD-pNA as substrates. The amount of pNA released was measured at 405 nm using an ELISA microplate reader. (C) To quantify the degree of apoptosis, the cells were stained with FITC-conjugated annexin V and PI for a flow cytometric analysis. (D) Cell viability was examined by MTT assay. The results are the mean ± SD obtained from three independent experiments (a p < 0.05 compared with the control group; b p < 0.05 compared with the H2O2-treated group; and c p < 0.05 compared with the glutathione- and H2O2-treated group).


