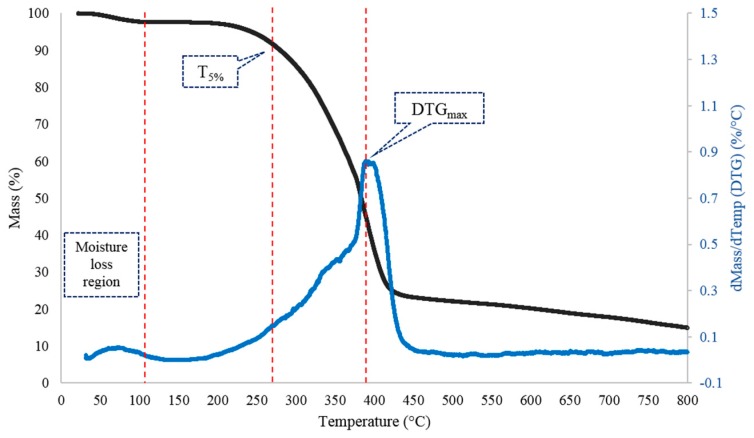
Figure 7.
Mass loss curve (black curve) with its first derivative (blue curve) of a representative polymer sample. Moisture loss occurs until about 110 °C. After that, the polymer sample is thermally stable up to about 275 °C (where 5% mass loss occurs post-moisture loss) and the maximum mass loss is observed at the peak of the derivative, i.e., about 390 °C.

