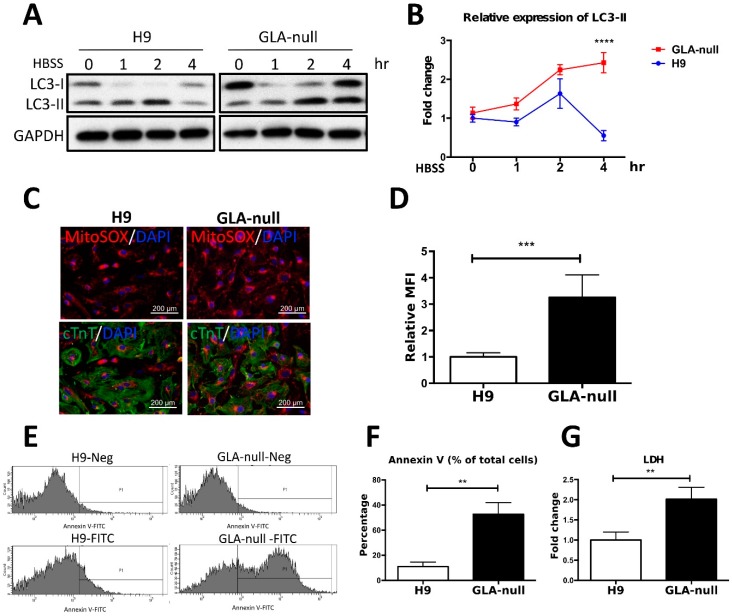
Figure 5.
Vesicle turnover impairment induces cardiotoxicity in GLA-null CMs. (A) Western blot showing expression of LC3 protein isoforms (LC3-I and LC3-II) in a time course of induction of autophagy with HBSS medium. GAPDH was used as a loading control. (B) The expression levels of LC3-II were measured by using ImageJ and the quantification results presented as mean ± standard deviation error bars from three independent experiments. (C) Staining of mitochondrial ROS in GLA-null CMs and H9 control CMs with MitoSOX Red. (D) MitoSOX Red fluorescence intensity quantified by flow cytometry presented as mean ± standard deviation from three independent experiments. (E) Flow cytometry analysis of annexin V-positive cells in populations of GLA-null and H9 CMs. (F) Quantitation of annexin V-positive cells. (G) The level of LDH secreted by H9 and GLA-null CMs. The data are presented as a fold change relative to H9 control. These data are presented as mean ± standard deviation error bars from three independent experiments.

