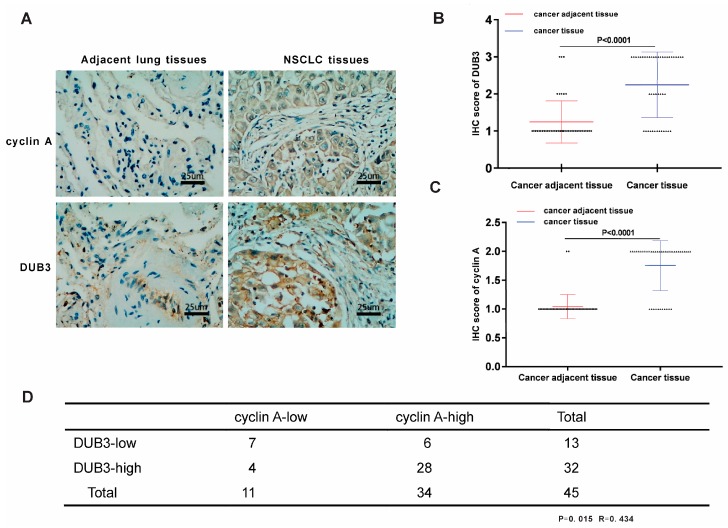
Figure 7.
DUB3 and cyclin A are overexpressed and positively correlated in NSCLC samples. (A) Representative images from immunohistochemical staining of DUB3 and cyclin A in adjacent lung tissues and NSCLC tissues were shown. Scale bars, 25 μm. (B,C) DUB3 (B) cyclin A (C) protein expression status in adjacent lung tissues and NSCLC tissues. (D) A summary of immunohistochemical staining for the correlation between DUB3 and cyclin A in NSCLC. The statistical analysis was determined by a X2 test.

