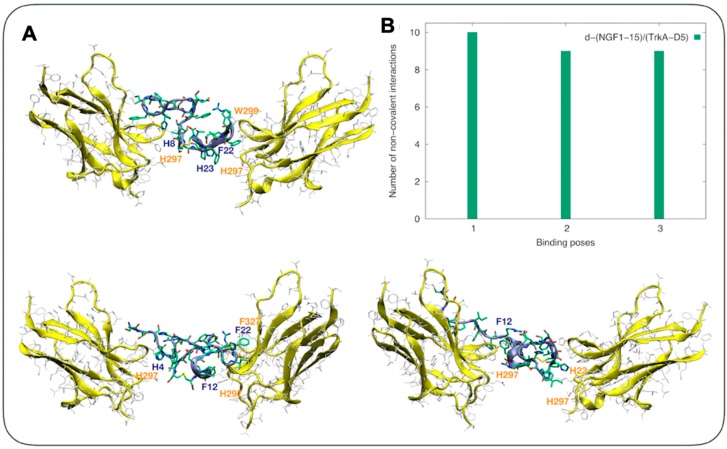
Figure 2.
(A) The three lowest energy binding modes for d-NGF(1-15)/TrkA-D5. TrkA-D5 backbone is shown by yellow ribbons, each residue is shown by silver sticks. The d-NGF(1-15) residues are shown by sticks. Carbon atoms are shown in green, nitrogen atoms in blue, and oxygen atoms in red. (B) The number of non-covalent intermolecular interactions calculated for the d-(NGF1-15)/TrkA-D5 complex.

