Figure 3.
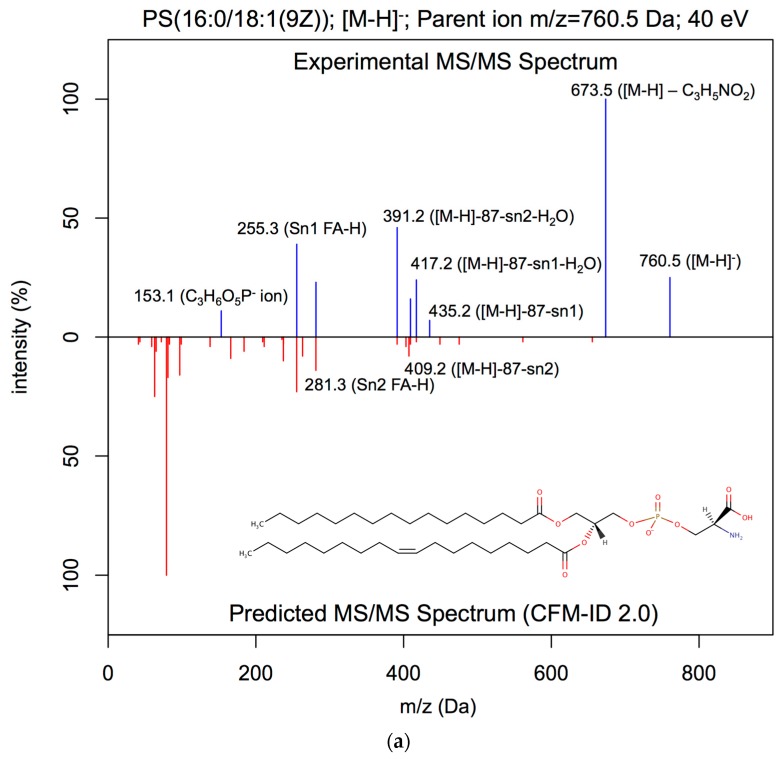
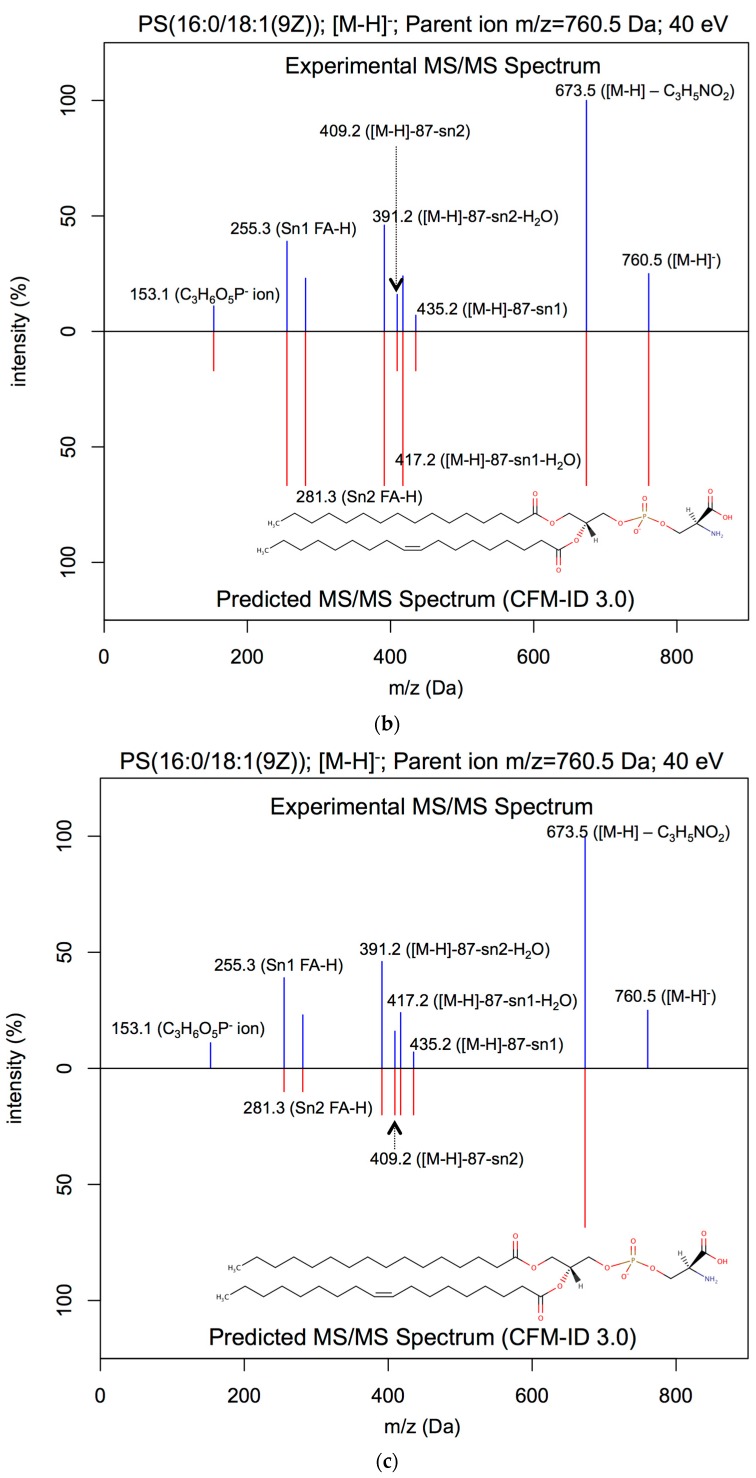
Head-to-tail plot of experimental and predicted ESI-MS/MS spectra of (PS(16:0/18:1(9Z))). (a) Head-to-tail plot showing an experimental of ESI-MS/MS spectrum of 1-palmitoyl-2-oleoyl-sn-glycero-3-phospho-L-serine (PS(16:0/18:1(9Z))) measured at 40 eV, and the matching ESI-MS/MS spectrum predicted by CFM-ID 2.0. The computed spectral similarity score is 0.10. (b) Head-to-tail plot showing an experimental ESI-MS/MS spectrum of 1-palmitoyl-2-oleoyl-sn-glycero-3-phospho-L-serine (PS(16:0/18:1(9Z))) measured at 40 eV, and the matching ESI-MS/MS spectrum predicted by CFM-ID 3.0. The computed similarity score is 0.92. (c) Head-to-tail plot showing an experimental ESI-MS/MS spectrum of 1-palmitoyl-2-oleoyl-sn-glycero-3-phospho-L-serine (PS(16:0/18:1(9Z))) measured at 40 eV, and the matching ESI-MS/MS spectrum predicted by LipidBlast. The computed similarity score is 0.91.


