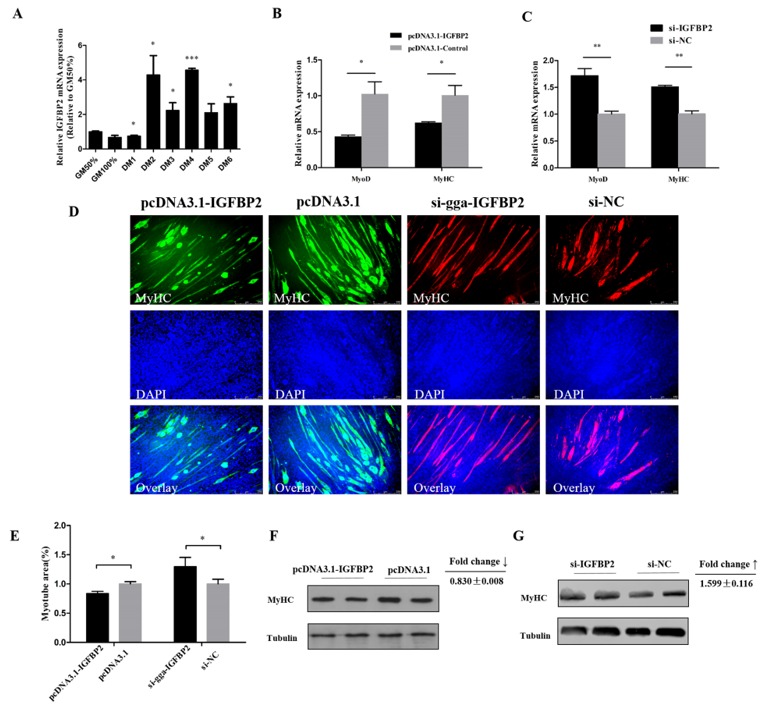
Figure 5.

IGFBP2 suppresses myotube formation. (A) The relative expression of IGFBP2 during CPM differentiation. (B,C) The mRNA level of MyoD and MyHC after overexpression or knockdown of IGFBP2 in CPM cells. (D,E) MyHC staining and the myotube area (%) of CPM cells 72 h after overexpression and knockdown of IGFBP2. (F,G) The protein level of MyHC after overexpression and inhibition of IGFBP2. Results are shown as mean ± S.E.M. and the data are representative of at least three independent assays. Independent sample t-test was used to analyze the statistical differences between groups. (* P < 0.05; ** P < 0.01, *** P < 0.001).
