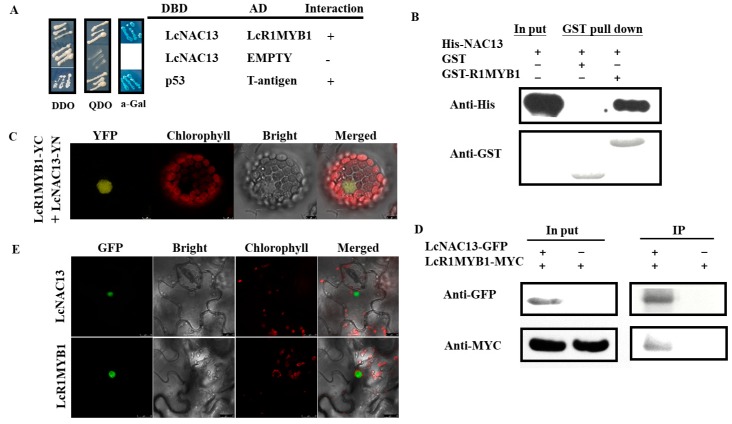
Figure 4.
Interaction between LcNAC13 and LcR1MYB1 in vitro and in vivo. (A) Interaction between LcNAC13 and LcR1MYB1 in the Y2H assay. (B) Interaction between LcNAC13 and LcR1MYB1 in vitro in the GST pull-down assay. (C) Interaction between LcNAC13 and LcR1MYB1 by bimolecular fluorescence complementation in Arabidopsis mesophyll protoplasts. (D) Interaction between LcR1MYB1 and LcNAC13 in the coimmunoprecipitation assay. (E) Subcellular localization of LcNAC13 and LcR1MYB1 in tobacco (Nicotiana benthamiana) leaves. Green signal indicates GFP fluorescence; yellower signal indicates YFP fluorescence; red signal indicates chlorophyll autofluorescence. The merged images represent digital combination of the chlorophyll autofluorescence and YFP fluorescent images or GFP fluorescent images. Scale bar = 10 μm.

