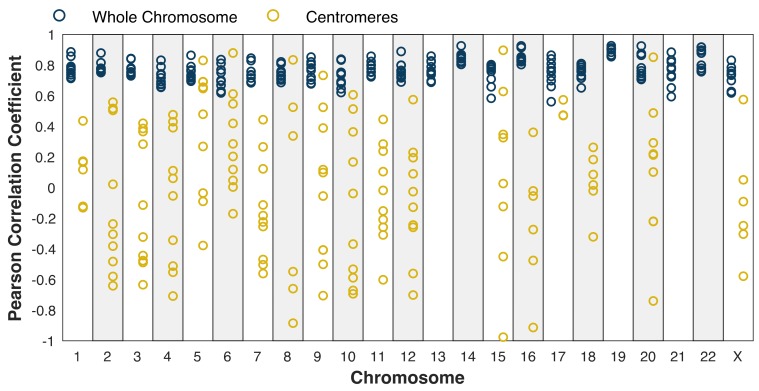
Figure 3.
Centromere replication timing is more variable between cell lines than chromosome-wide replication timing. Blue: whole chromosome (excluding centromere); gold: centromeres. Pearson correlation was calculated for each mappable centromere (see Figure 1) and for each chromosome for each pair of cell lines. Dots represent individual pairwise comparisons. The difference in the distribution of correlation coefficients between the centromeres and whole chromosomes is robust when controlling for the size of the centromeres (Figure S5).

