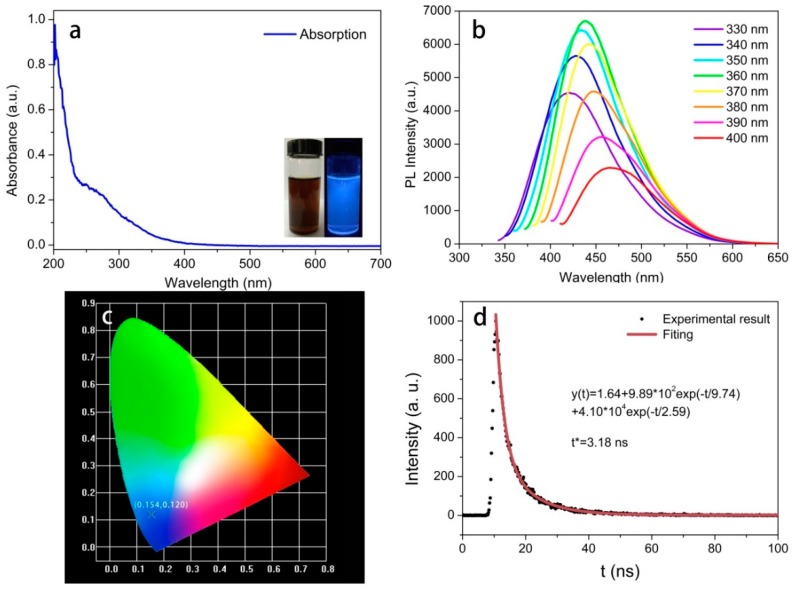
Figure 5.
(a) Absorption spectrum of the CQDs under 360 nm excitation; inset: optical images under daylight (left) and UV light (right); (b) PL emission spectra of the CQDs at increasing excitation wavelengths from 330 to 400 nm in 10-nm increments; (c) CIE chromaticity diagram of the CQDs; (d) fluorescence decay curve of CQDs fitted by two-order exponential functions, and the fitting Equation is shown in the corresponding panel.

