Figure 1.
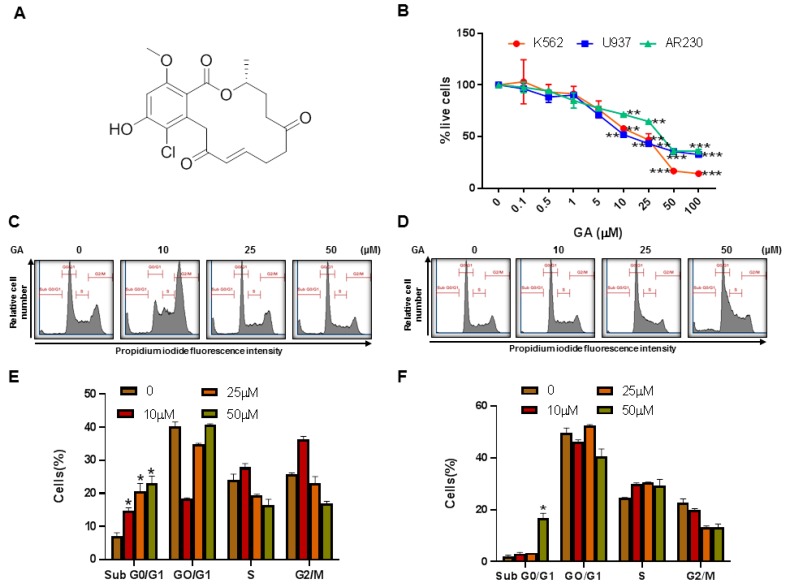
Effects of greensporone A (GA)–on cell proliferation and cell cycle. (A) Molecular structure of Greensporone A. (B) MTT assay was used to measure cell viability as mentioned in Section 2. Cell cycle fraction analysis of cells in response to GA. (C) K562 and (D) U937 cells were treated with GA, as indicated, and analyzed by flow cytometry. GA significantly enhanced SubG0 fraction in (E) K562 and (F) U937. The graph displays the mean ± SD of three independent experiments. * P < 0.05, ** P < 0.01, *** P < 0.001.

