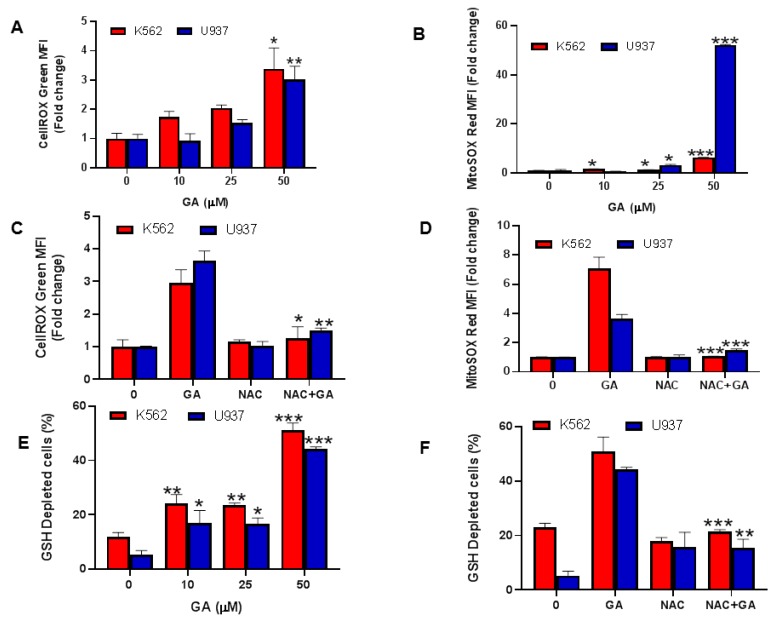
Figure 6.
Greensporone A-mediated generation of reactive oxygen species (ROS) in leukemic cells. K562 and U937 were treated with greensporone A for 24 h. (A–D) Cellrox and mitoSOX assays were performed to evaluate the level of ROS by flow cytometry as described in Section 2. (E,F) Glutathione level was determined by flow cytometry. K562 and U937 cells were treated with greensporone A for 24 h and glutathione level was determined using a ThioTracker assay kit. The graph displays the mean ± SD (standard deviation) fold change release of ROS of three experiments (* P < 0.05, ** P < 0.01, *** P < 0.001).

