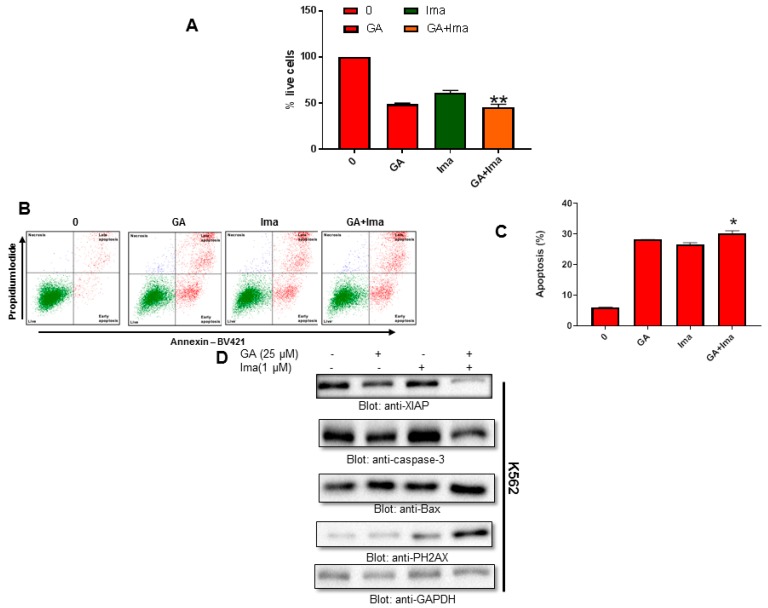
Figure 8.
Cytotoxic activity of imatinib and greensporone A in leukemic cell lines. (A–C) K562 cells were treated with greensporone A (25 μM) and imatinib (1 μM) alone and in combination, and analyzed for cell proliferation and apoptosis by flow cytometry. The graph displays the mean ± SD of three independent experiments (* P < 0.05, ** P < 0.01 and *** P < 0.001). (D) K562 leukemic cells were treated with greensporone A (25 μM) and imatinib (1 μM) for 48 h and lysed cell extracts were separated on SDS-PAGE, transferred to PVDF membrane, and immunoblotted with an antibody against XIAP, procaspase-3, BAX, PH2AX, and GAPDH.

