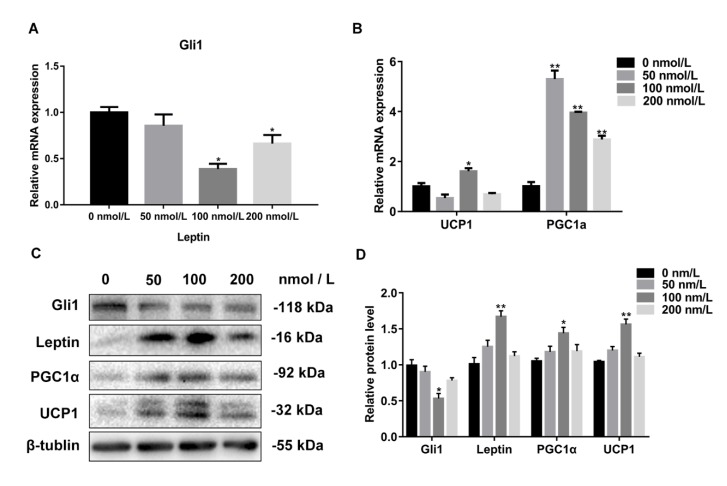
Figure 5.
The expression level of Gli1 is negatively correlated with the concentration of leptin. (A) RT-qPCR was used to detect the key transcription factor Gli1 of the Hh signaling pathway. (B) RT-qPCR was used to detect the white adipose thermogenic related genes. (C) Western blotting was used to detect the expression of genes associated with the Hh signaling pathway, and thermogenic relative genes. (D) The resulting quantity protein level. Data are expressed as the means ± SD of three independent experiments. *, p < 0.05; **, p < 0.01.

