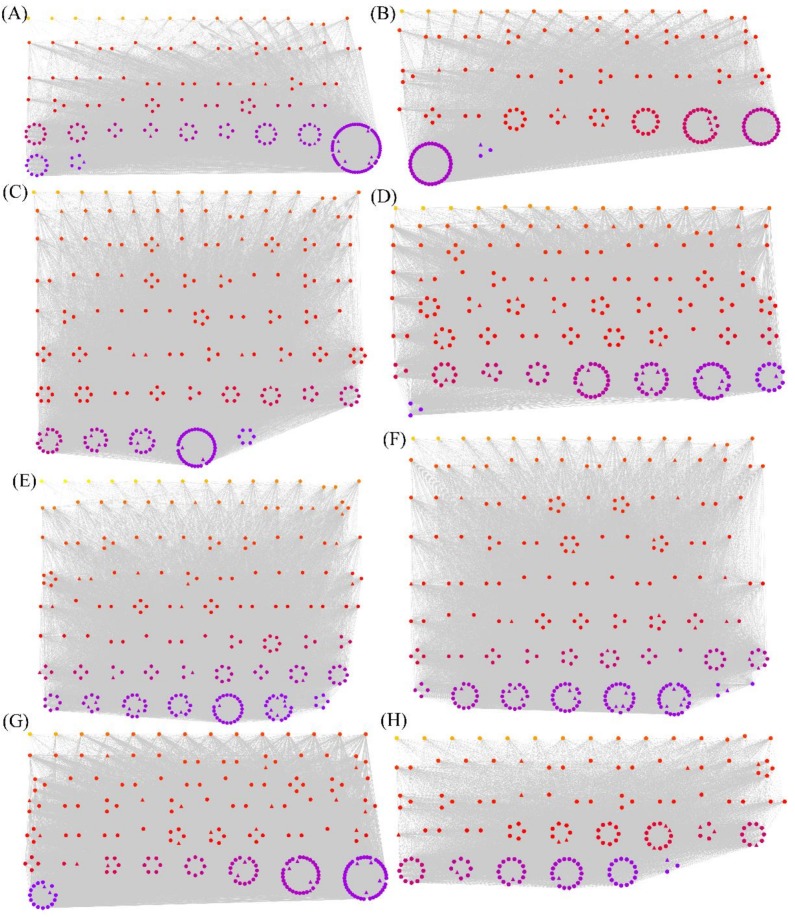
Figure 3.
Visualization of the eight co-expression networks by Cytoscape. (A) the red, (B) black, (C) blue, (D) brown, (E) yellow, (F) turquoise, (G) green, and (H) pink modules, respectively. The most and least highly connected genes are shown in purple and yellow, respectively. The TFs are indicated by triangles, whereas the remaining genes are indicated by circles.

