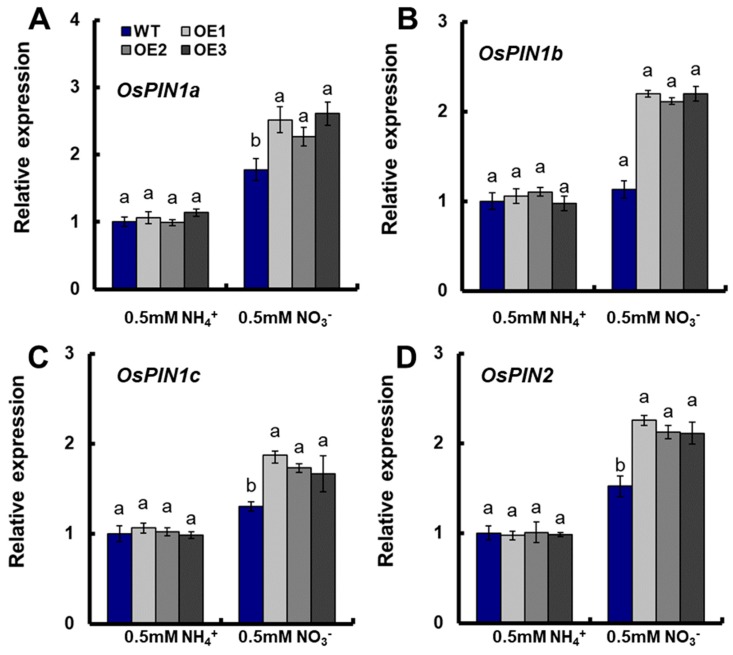
Figure 4.
The expressions of OsPINs in the roots of WT and OsNRT2.1 transgenic lines under 0.5-mM NH4+ or 0.5 mM NO3− conditions. WT and transgenic plants on the 10th day were shown in Figure 3. Real-time quantitative RT-PCR analysis of the expressions of (A) OsPIN1a, (B) OsPIN1b, (C) OsPIN1c, and (D) OsPIN2 in WT and OsNRT2.1 transgenic lines. RNA was extracted from roots. Error bars: SE (n = 5). Significant differences between transgenic lines and WT are indicated by different letters (p < 0.05, one-way ANOVA).

