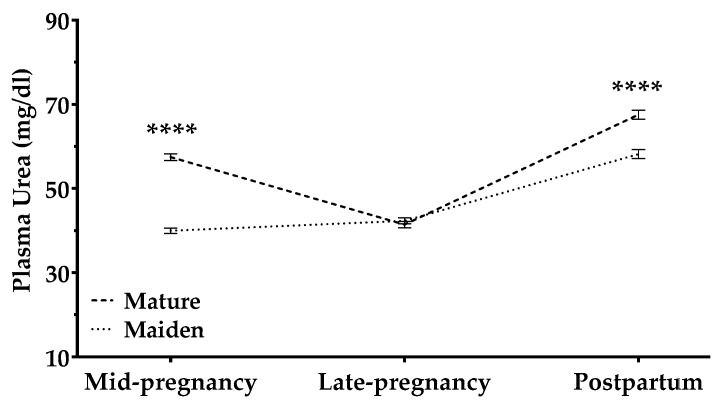
Figure 8.
Plasma urea concentrations (mg/dL) in mature ewes (dashed line) and maiden sheep (dotted lines) throughout the study period. Data are mean ± S.E.M. The time × age-group interaction was significant (p < 0.0001). Asterisks indicate significant differences between age groups at each time point (**** p < 0.0001).

