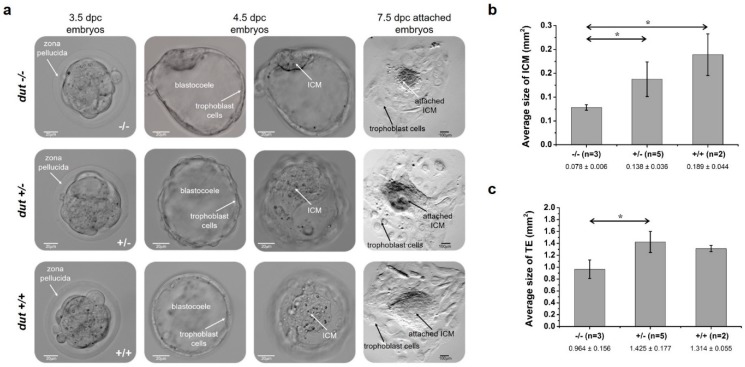
Figure 3.
Outgrowth assay of pre-implantation embryos obtained by intercrossing D47 heterozygous mice. (a) Phase contrast images of D47 homozygous (−/−), heterozygous (+/–), and wild-type (+/+) blastocysts in in vitro culture. The first column shows embryos at 3.5 dpc after flushing from oviducts. White arrows indicate the zona pellucida surrounding the embryos. The second and third columns show the attached embryos, one day later focusing on the trophoblast cells or the inner cell mass (ICM) in the blastocoel. Scale bar represents 20 µm. The last column presents outgrowths after four days in culture. Scale bar represents 100 µm. Average size of ICM (b) and trophectoderm (TE) (c) was calculated for blastocysts of indicated genotypes. Error bars indicate standard deviation. n = 3 for (−/−), n = 5 for (+/–), and n = 2 for (+/+). Statistical analysis was done with a two-sample, single-tailed t-test assuming equal variance using Microsoft Excel. * p < 0.05.

