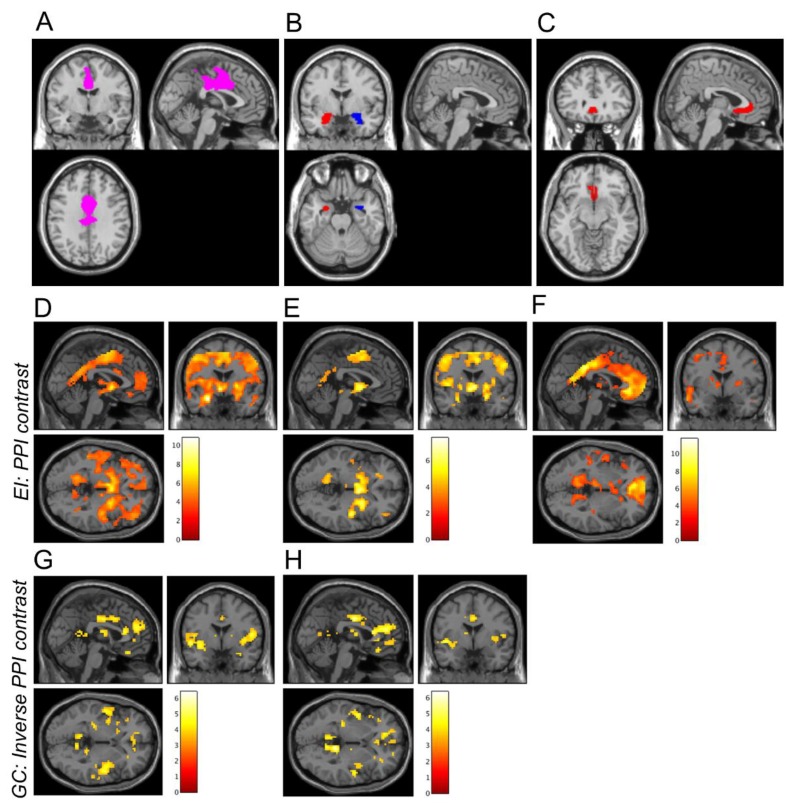
Figure 1.
A priori ROIs and whole-brain PPI connectivity averaged across all runs and scan days. Figure A depicts the DMFC ROI used as a target region in the PPI analysis (A). Figure B,C depict the three seed regions: the left and right amygdala (B) and the subgenual anterior cingulate cortex (C). D,H depict results from seed regions showing significant PPI effects in the DMFC cortex ROI. Increases in whole-brain connectivity (positive PPI contrast) were observed during the EI task for the left amygdala (D), right amygdala (E), and subgenual anterior cingulate cortex (F) seeds. Decreases in whole-brain PPI connectivity (negative PPI contrast) were observed during the GC task for the left amygdala (G) and right amygdala (H) seeds. For illustrative purposes only, images were thresholded at p < 0.001 (uncorrected), and the colour bars indicate t-values. The inverse PPI contrast is displayed for the GC task (G,H) because mean PPI connectivity with the DMFC ROI was significantly negative (see Figure 2).

