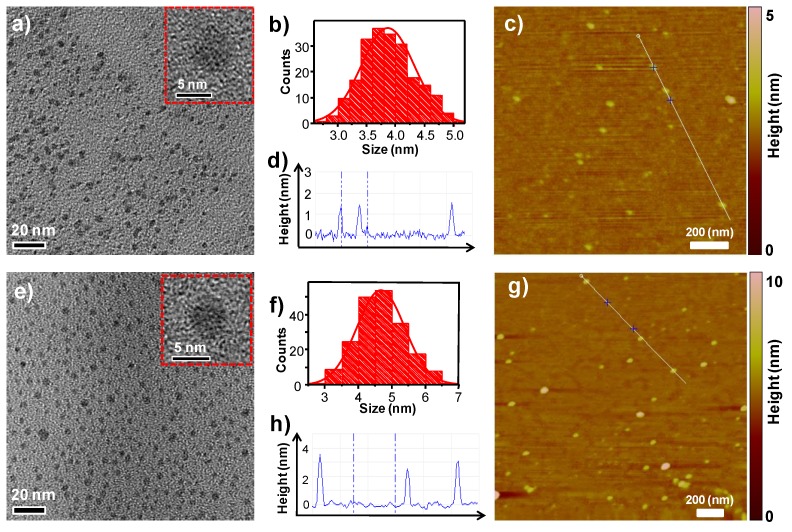
Figure 3.
(a) TEM and high resolution TEM images of the g-CDs; (b) Size distribution of the g-CDs based on the TEM; (c) AFM image of the g-CDs; (d) height-profile analysis of the g-CDs along the line in (c); (e) TEM and high resolution TEM images of the r-CDs; (f) Size distribution of the r-CDs based on the TEM; (g) AFM image of the r-CDs; (h) height-profile analysis of the r-CDs along the line in (g).

