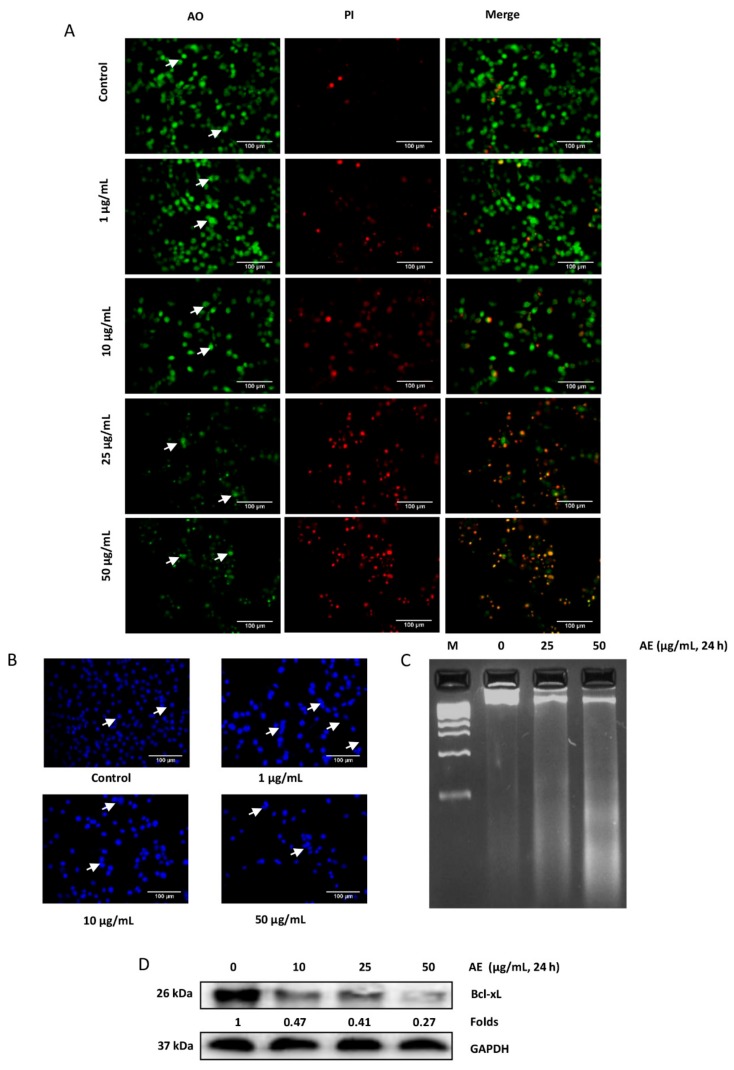
Figure 2.
Acetone extract induces apoptosis in glioma cells. (A) C-6 glioma cells were exposed to different concentrations (µg/mL) of acetone extract. After 24 h, cells were stained with acridine orange (AO)/propidium iodide (PI) (10 µg/mL) and observed under fluorescence microscope. As indicated by arrows, control cells exhibited round to oval shaped green nucleus. In treated cells, orange to red fluorescence was observed with condensed and fragmented nucleus. (B) C-6 cells were treated with indicated concentration (µg/mL) of acetone extract. After 24 h, cells were fixed, permeabilized and mounted with DAPI. While fragmentation was observed in the treated cells, round and oval shaped nuclei were observed in the control cells as shown by arrows. (C) C-6 cells were exposed to acetone extract for 24 h, DNA was isolated and electrophoresed on agarose gel. Note the presence of DNA smear in the treated cells at higher concentration. (D) C-6 cells were exposed to indicated concentrations (µg/mL) of acetone extract for 24 h and the expression of Bcl-xL was examined in the whole cell extract by western blotting. Glyceraldehyde-3-phosphate dehydrogenase (GAPDH) was used as an internal control. Values below the blot indicate fold change in the Bcl-xL expression compared to control. The scale bar represents 100 µm. AE, acetone extract.

