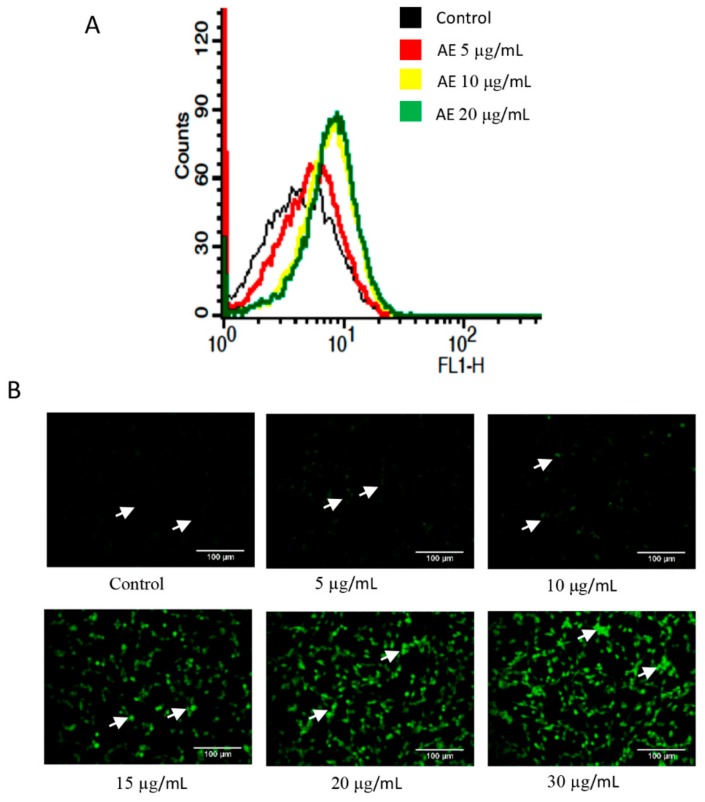
Figure 5.
Acetone extract induces reactive oxygen species (ROS) generation. (A) C-6 cells were treated with indicated concentrations (µg/mL) of acetone extract for 1 h. The cells were then stained with H2DCFDA (10 µM) for 30 min and ROS generation was measured by flow cytometry. (B) The stained cells were also visualized under fluorescence microscope. The arrows indicate DCFDA stained cells in the control and treated groups. Note a concentration dependent increase in the level of ROS (DCFDA stained cells) after treatment with acetone extract. The scale bar represents 100 µm. AE, acetone extract.

