FIGURE 11.

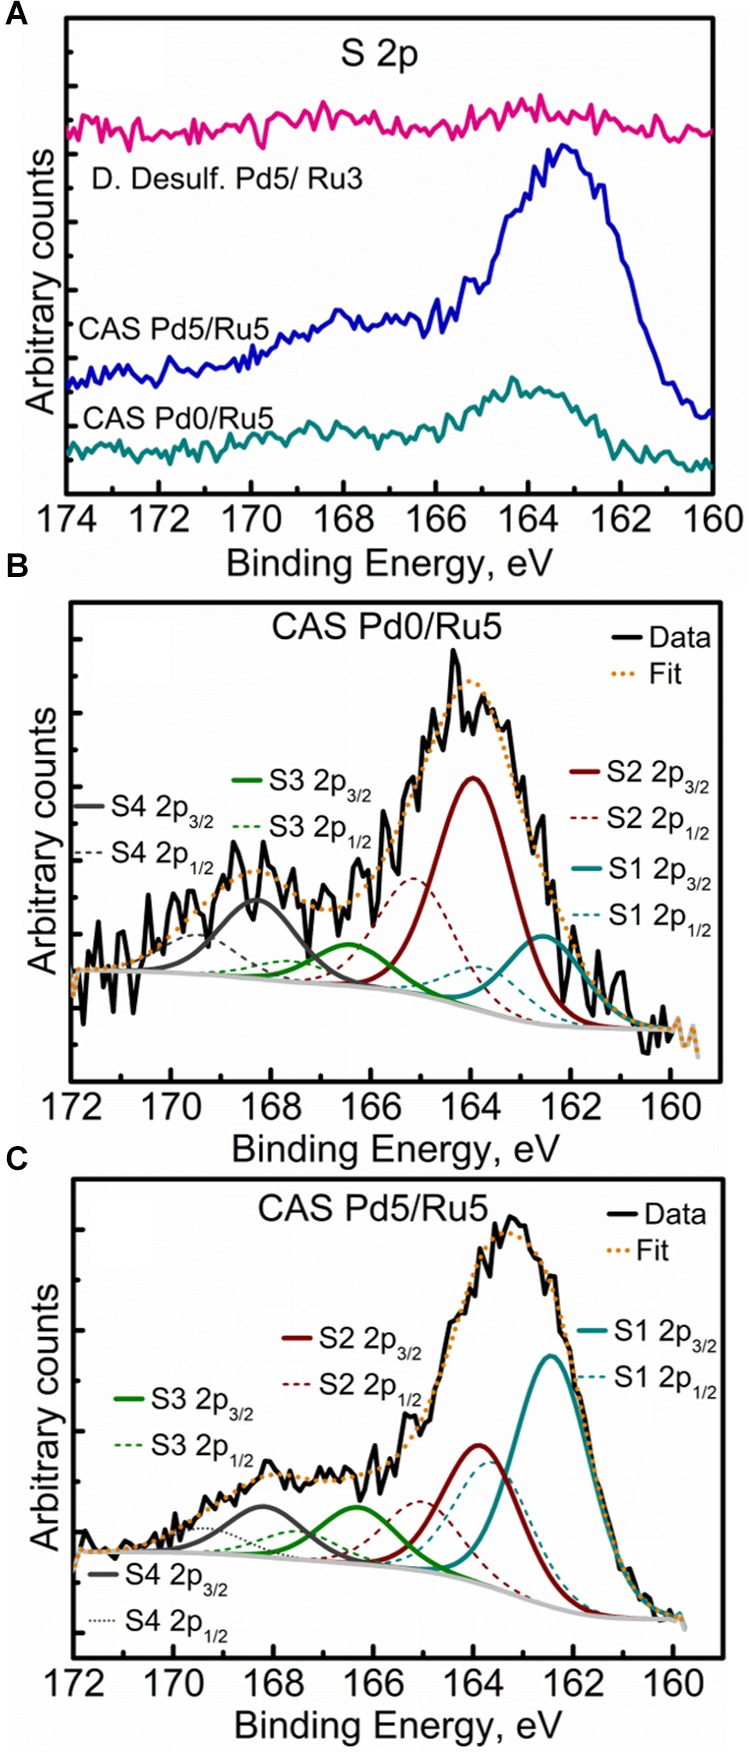
High Resolution S 2p spectra showing (A) comparison of the three metallized bacterial samples, (B) fitted components for the CAS Pd0/Ru5 sample, and (C) fitted components for the CAS Pd5/Ru5 sample.

High Resolution S 2p spectra showing (A) comparison of the three metallized bacterial samples, (B) fitted components for the CAS Pd0/Ru5 sample, and (C) fitted components for the CAS Pd5/Ru5 sample.