FIGURE 3.

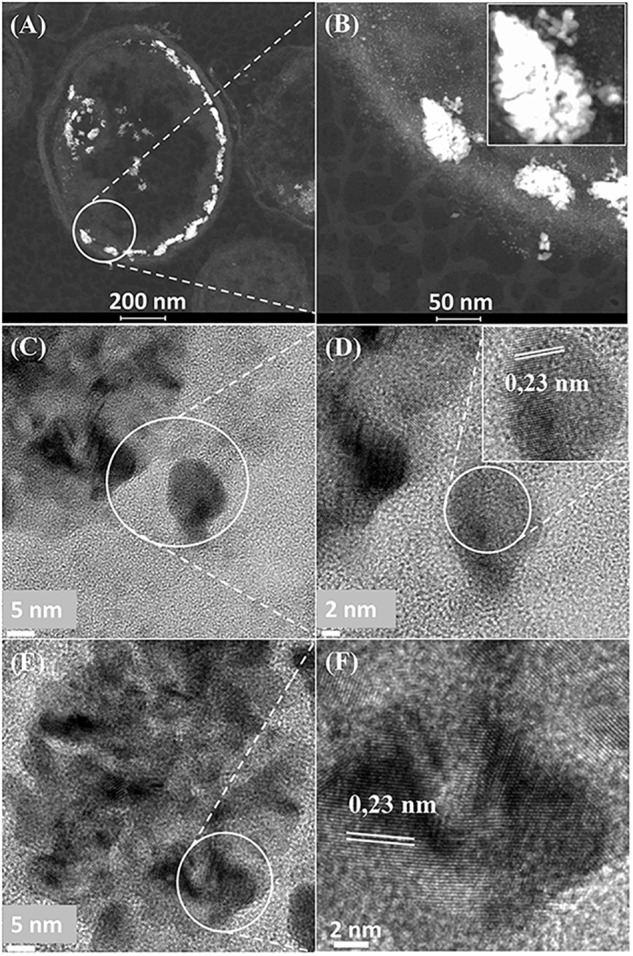
(A) Region of cell surface shown in Figure 2E–H. Enlarged image (B, inset) shows that the large NPs are agglomerations of smaller ones. Crystal lattice spacings are shown for a NP outside (C,D) and within (E,F) an agglomeration.

(A) Region of cell surface shown in Figure 2E–H. Enlarged image (B, inset) shows that the large NPs are agglomerations of smaller ones. Crystal lattice spacings are shown for a NP outside (C,D) and within (E,F) an agglomeration.