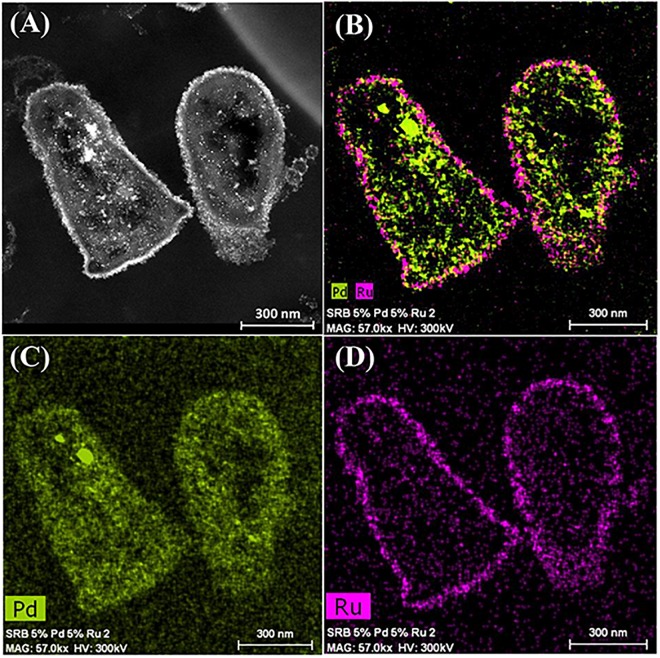
FIGURE 6.
Elemental mapping of distribution of Ru and Pd in two type I cells (as in Figure 4) showing superimposition of Pd (green, B) and Ru (magenta, D) occurrences. Individual maps (C,D) show very little Ru inside the cells although Pd is distributed uniformly between the cell surface and intracellular regions.

