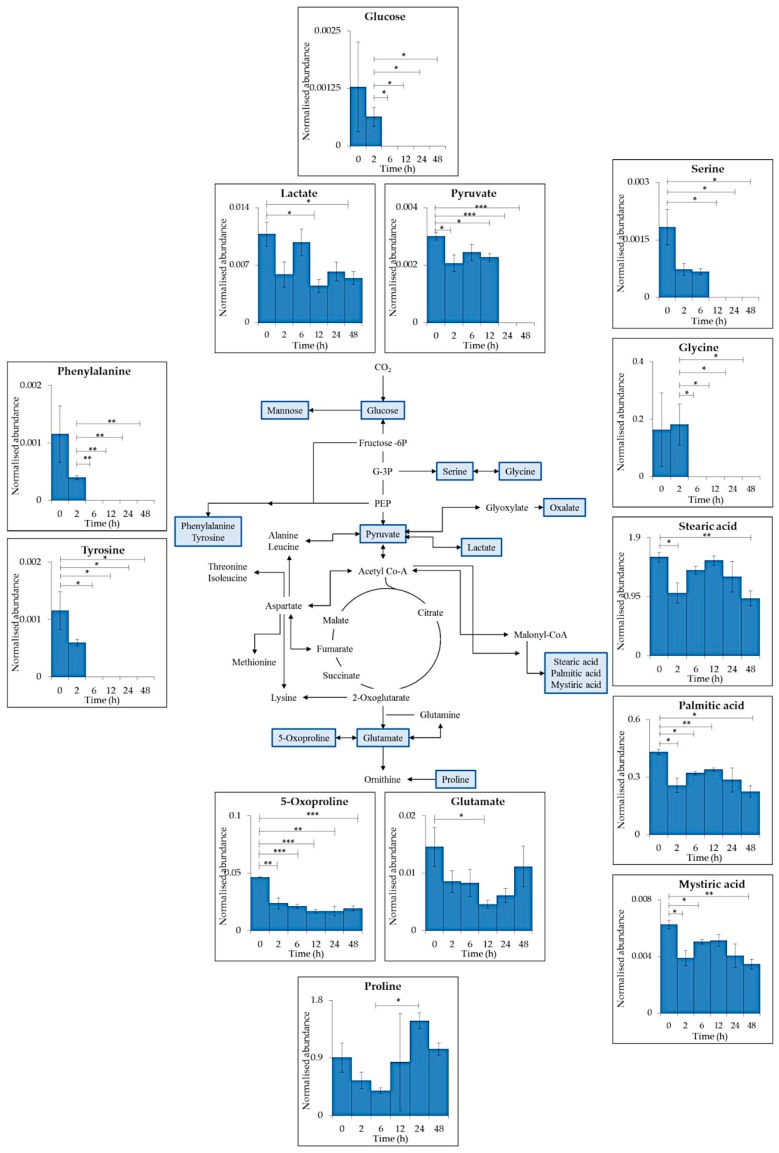
Figure 2.
Schematic representation of a generalised reduced carbon metabolism in the cyanobacterium C. fritschii showing glycolysis, the citric acid (TCA) cycle, amino acid and fatty acid biosynthesis. Primary metabolites identified in intracellular samples using GC–MS are highlighted in blue with each insert presenting mean values of normalised abundance (normalised to internal standard and dry weight) ± standard error of each metabolite during supplemented UV-B exposure PAR + UV-B). Statistical significance between control (0 h) and UV-B exposure (2, 6, 12, 24 and 48 h) and between each treatment time point was measured using a two-sample T-test with equal variance; * = 0.05 ≥ p ≥ 0.01, ** = 0.01 ≥ p ≥ 0.001 and *** = p ≤ 0.001.

