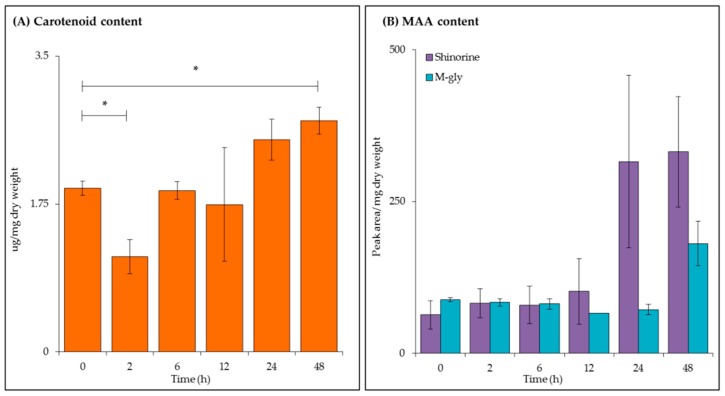
Figure 3.
Carotenoid and mycosporine-like amino acid (MAA) analysis of C. fritschii extracts during UV-B exposure. (A) Total carotenoid concentration as measured by UV-visible spectroscopy and (B) shinorine and mycosporine-glycine (m-gly) content measured by high-performance liquid chromatography (HPLC) analysis. All values are the mean of three biological replicates (normalised to dry weight) ± standard error. Statistical significance was measured using a two-sample T-test with equal variance; * = 0.05 ≥ p ≥ 0.01, ** = 0.01 ≥ p ≥ 0.001 and *** = p ≤ 0.001.

