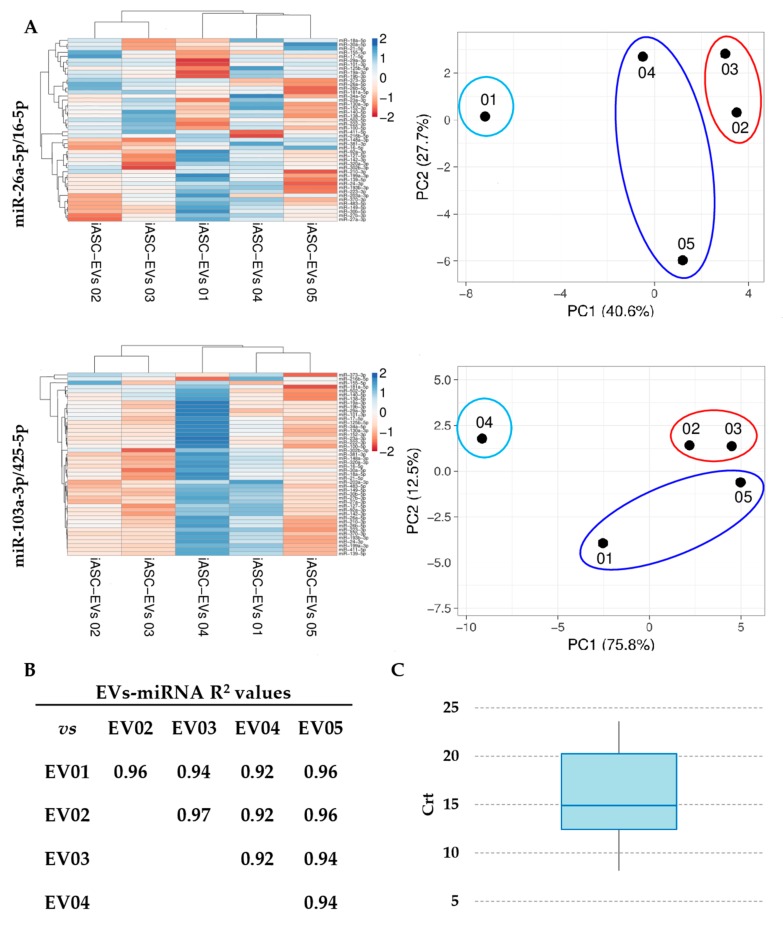
Figure 3.
Influence of RG selection on iASC-EVs miRNA profile. (A) Heatmap of hierarchical clustering analysis and principal component analysis of the Crt values of 46 iASC-EVs miRNAs after stable miR-26a-5p/16-5p or unreliable miR-103a-3p/425-5p normalization. Rows were centered. Each row represents a miRNA and each column represents a sample. The sample clustering tree is shown at the top. The color scale shown in the map illustrates the relative expression levels of miRNAs across all samples: red shades represent high expression levels (low Crt) and blue shades represent lower expression levels (high Crt). miRNAs from the heat maps are shown in Supplementary Table S2. (B) Correlation of miRNA expression levels (normalized Crt) between the five iASC-EVs under study. (C) Box-plot of mean normalized Crt values for 46 miRNAs embedded in iASC-EVs.

