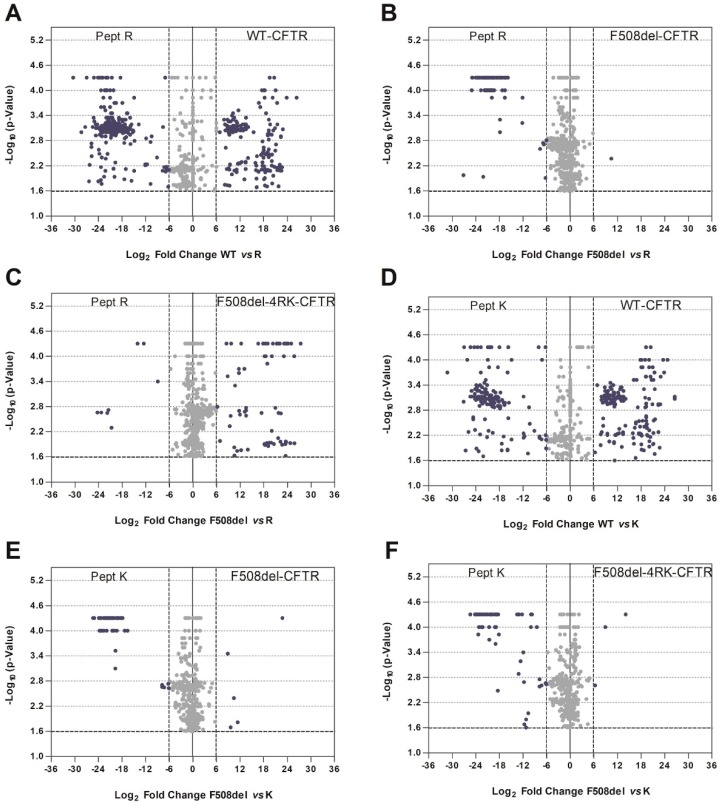
Figure 5.
Volcano plots for pairwise comparisons of the interactomes related to AFT recognition. Significance is represented by−log10 p-value calculated using permutation tests (10,000 permutations), and the protein affinity for the two variants under analysis is assessed as described in the text. Blue dots represent hits selected based on p-values < 0.025 and |fold change| >6. A–F: Pairwise comparisons as included in the figure.

