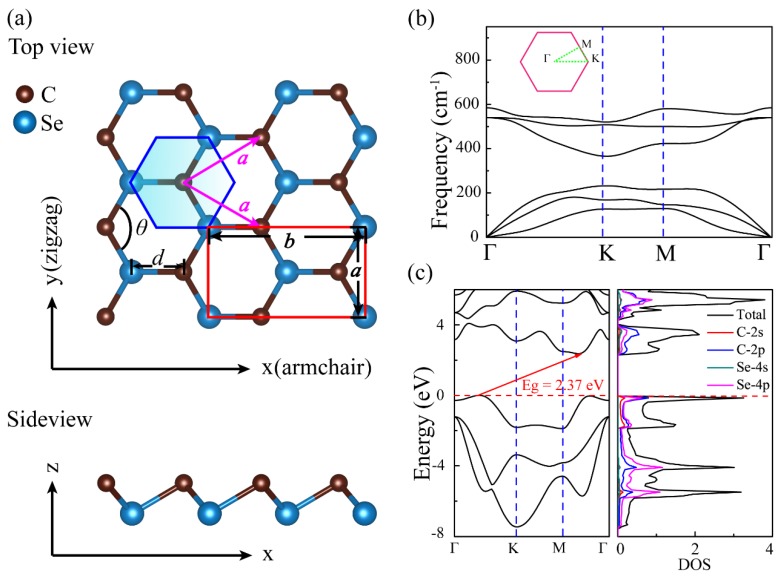
Figure 1.
(a) The top and side views of monolayer carbon selenide (β-CSe). The shade region represents a primitive cell. A rectangular cell in top view also is marked, and used to calculate stress-strain relationships. (b) Phonon band diagram, where the panel represents the high-symmetry k-points in the first BZ of the hexagonal reciprocal unit cell. (c) Electronic band diagram, and the total and orbital projected partial density of states for the monolayer β-CSe, at the HSE06 level. The indirect bandgap of the monolayer is guided by the red arrow and the bandgap value is also provided. The Fermi level is set at zero.

