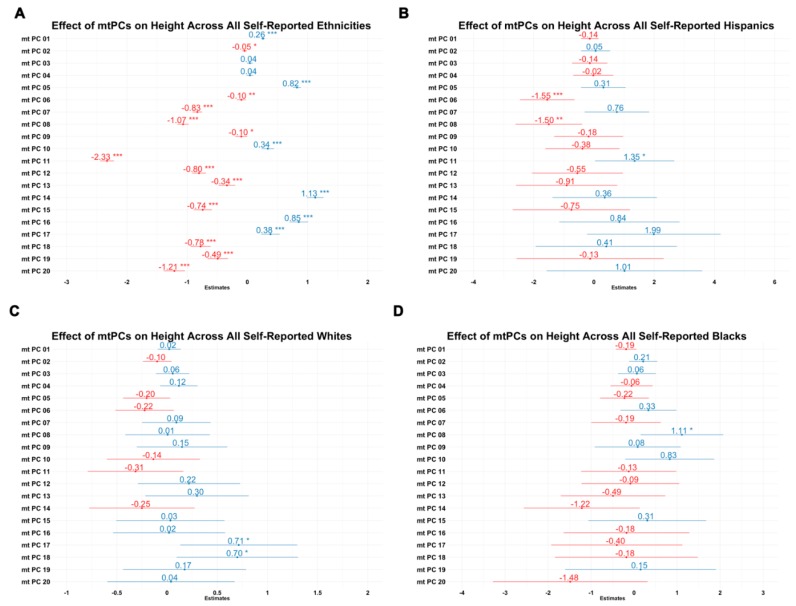
Figure 5.
Effects of 20 mitochondrial principal components on height (centimeters) in inter-ethnic and intra-ethnic samples. (A) Combined analysis; (B) Hispanic analysis; (C) White analysis; (D) Black analysis. X axes are the coefficient estimate for mitochondrial principal component number (Y axes). * p < 0.05; ** p < 0.01; *** p < 0.001.

