Figure 1.
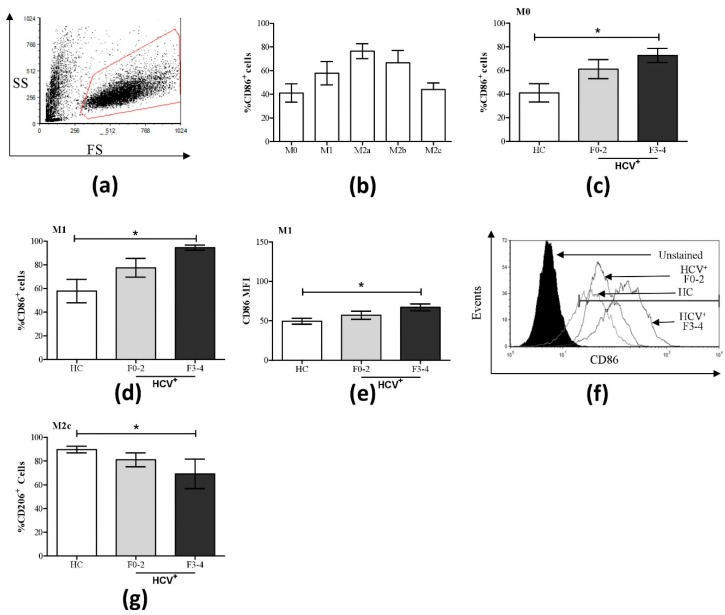
Increased percentage of CD86+ cells in M0 and M1 macrophage subsets and decreased CD206 expression in M2c cells in HCV infection. The expression of CD86 and CD206 was assessed on macrophage subsets from healthy controls (HC, n = 9) and HCV-infected individuals with minimal (F0-2, n = 9) or advanced liver fibrosis (F3-4, n = 4) by flow cytometry. (a) A representative dot plot of macrophage flow cytometry gating based on forward and side scatter is shown. (b) The proportion (%) of CD86+ cells across all macrophage subsets from healthy individuals is shown. Significant changes in % CD86+ cells in HCV+ study groups are shown for (c) M0 and (d) M1 cells. (e) Included is the degree of CD86 expression (mean fluorescence intensity, MFI) in M1 cells, which is accompanied by (f) a representative histogram with overlapping data traces from an uninfected donor and HCV-infected individuals with minimal or advanced liver fibrosis. (g) Significant changes in the % CD206+ cells were also found in the M2c subset. Statistical significance was determined in healthy controls by one-way, paired Student’s t-tests, and significance among HCV-infected groups was determined by a one-way ANOVA (p ≤ 0.05). Significant p-values are indicated with an asterisk “*”.

