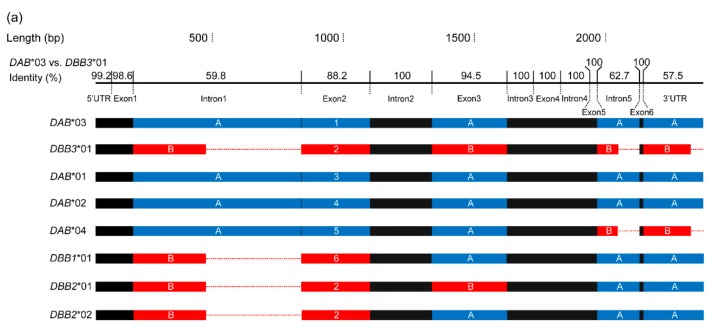
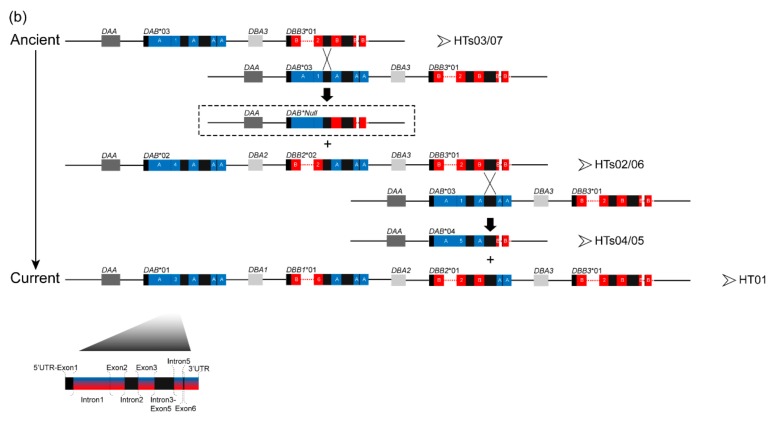
Figure 4.
Comparison of the full-length IIβ sequences (a) and evolutionary model of the class II regions in seven MHC haplotypes (b) in crested ibis. Blue (A) and red (B) boxes respectively indicate “type A” and “type B” regions represented by DAB*03 and DBB3*01. Numbers on exon 2 represent different nucleotide sequences. Black boxes indicate highly similar homologous regions which provide good opportunities for unequal crossing over between two ancestral IIβ genes. Dotted lines indicate alignment gaps. (a) Sequence identity (%) for each gene region was calculated in Lasergene software (DNASTAR Inc., Madison, WI) for DAB*03 vs. DBB3*01. (b) Dark and light grey boxes represent DAA and DBAs, respectively. The scale for intragenic regions is shown in the lower left corner. Breakpoints of recombination (as indicated by RDP) are shown by black crosses (intron 2 and intron 3–exon 5). The haplotype framed by the dashed-line was not detected in this study.


