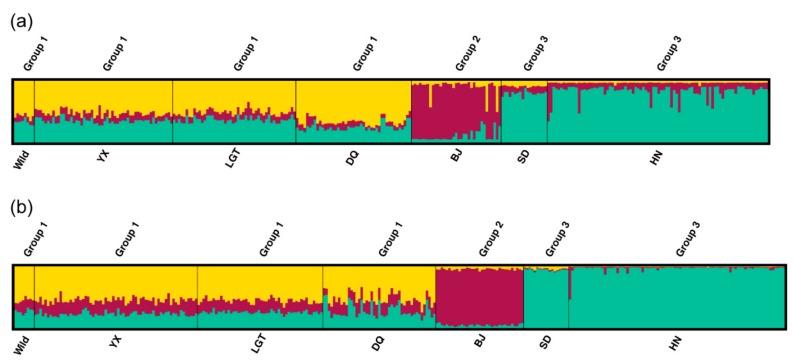
Figure 5.
Bayesian clustering analysis (K = 3) using (a) MHC haplotypes and (b) microsatellite markers. Each individual is represented by a vertical bar, vertically partitioned into segments with lengths proportional to the individual’s estimated membership fraction of each of the three inferred clusters indicated by different colors. The seven populations are separated by black lines and can be divided into three groups based on the proportion of membership of the three clusters.

