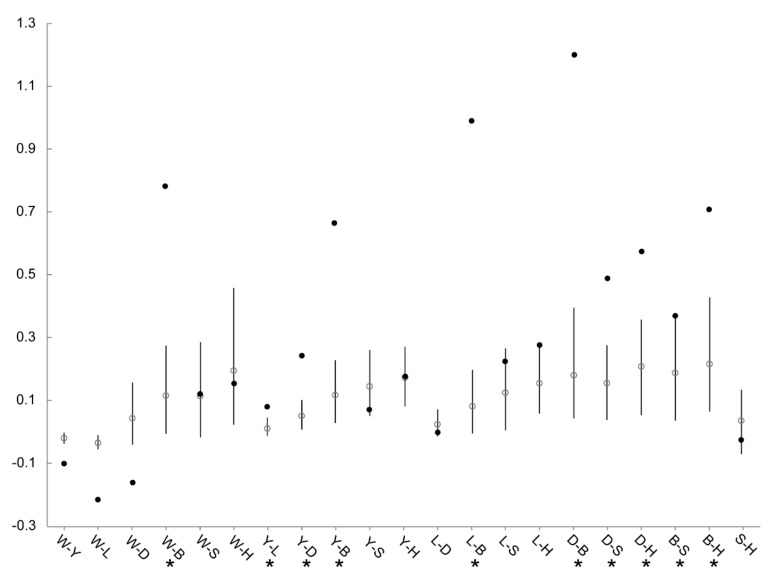
Figure 6.
Comparison between pairwise G’ST for MHC haplotypes and microsatellite loci among seven populations of the crested ibis. Pairwise G’ST with 95% CIs for microsatellite loci is indicated by white circles with corresponding error bars. Black circles indicate pairwise MHC-G’ST values. Pairwise populations with significantly higher MHC-G’ST than microsatellite-G’ST values are marked by asterisks. Populations are W, Wild; Y, YX; L, LGT; D, DQ; B, BJ; S, SD, and H, HN.

