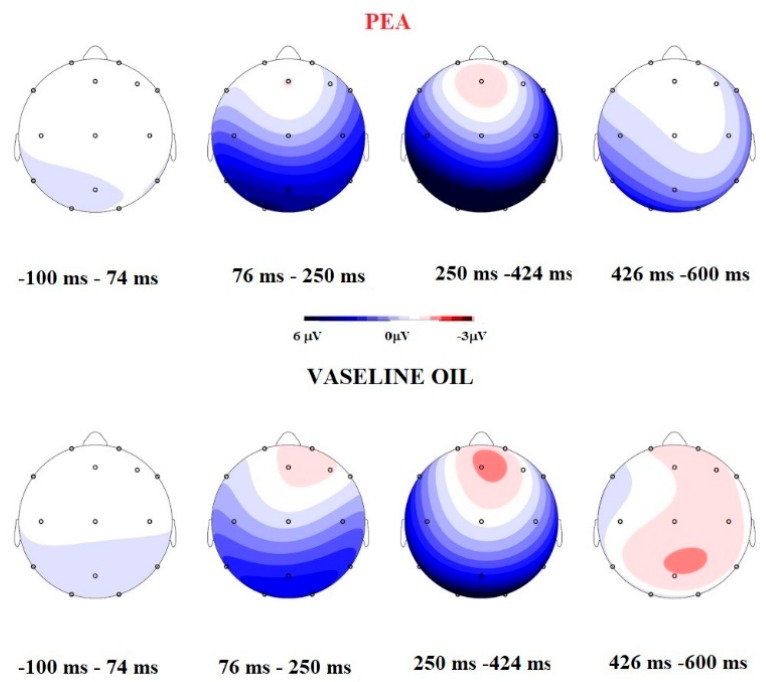
Figure 2.
Comparison between Mapping during four different temporal ranges and between OERP component. The Mapping during PEA stimulation indicates that is present a more negative activation in the temporal range 250–425 ms, and positive components during the Vaseline Oil stimulation. The OERP amplitude comparison shows that PEA elicited ampler N1 and decreased late positive component (LPC).

