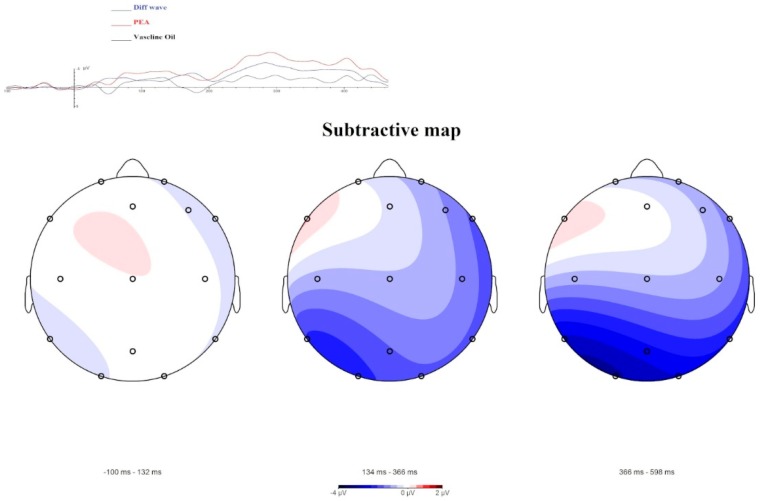
Figure 3.
A subtractive visualization of the OERP component and of Mapping. The blue line of OERP component shows the difference wave between PEA condition and Vaseline Oil condition. The Mapping representation highlights a negative activity (linked to N1 results) shifted in a delayed temporal range (306–600 ms). This negative amplitude is related to the odorant characteristic of the stimulus.

